
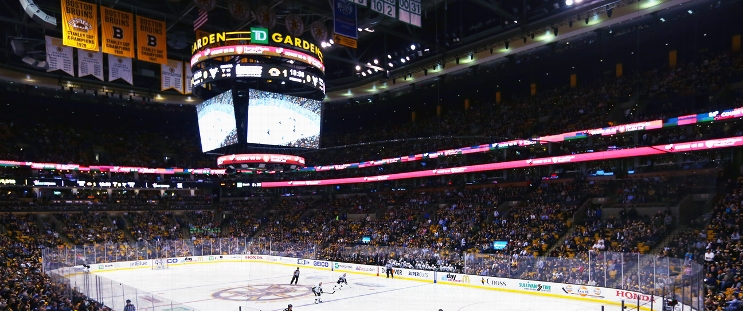
Winnipeg Jets at Boston Bruins
· National Hockey League

Regular Season Series
BOS leads series 1-0
Statistics
 WPG |
 BOS |
|
|---|---|---|
| 3.00 | Goals Against Average | 2.11 |
| 29.3 | Shots Against per Game | 28.2 |
| 78.9 | Penalty Kill Percentage | 81.3 |
| 4 | Power Play Goals Against | 6 |
| 0 | Short Handed Goals Against | 0 |
| 2.88 | Goals For per Game | 3.78 |
| 26.6 | Shots per Game | 25.4 |
| 6 | Power Play Goals | 6 |
| 30.0 | Power Play Percentage | 25.0 |
| 0 | Short Handed Goals | 0 |
| 59 | Penalty Minutes | 119 |
 Boston Bruins Injuries
| NAME, POS | STATUS | DATE |
|---|---|---|
| Pavel Zacha, C | Day-To-Day | Oct 19 |
 Winnipeg Jets Injuries
| NAME, POS | STATUS | DATE |
|---|---|---|
| Josh Morrissey, D | Injured Reserve | Oct 19 |
| Vladislav Namestnikov, C | Out | Oct 16 |
| Connor Hellebuyck, G | Injured Reserve | Oct 2 |
| Garrett Brown, C | Injured Reserve | Sep 29 |
















 ANA
 CAR
 PHI
 SJ
 LA