
San Jose Sharks at Dallas Stars
· National Hockey League

Regular Season Series
DAL leads series 1-0
Statistics
 SJ |
 DAL |
|
|---|---|---|
| 3.50 | Goals Against Average | 1.50 |
| 27.5 | Shots Against per Game | 22.6 |
| 80.8 | Penalty Kill Percentage | 89.3 |
| 5 | Power Play Goals Against | 3 |
| 0 | Short Handed Goals Against | 0 |
| 2.63 | Goals For per Game | 2.38 |
| 27.6 | Shots per Game | 25.5 |
| 6 | Power Play Goals | 3 |
| 23.1 | Power Play Percentage | 15.0 |
| 1 | Short Handed Goals | 1 |
| 79 | Penalty Minutes | 75 |
 Dallas Stars Injuries
| NAME, POS | STATUS | DATE |
|---|---|---|
| Roope Hintz, C | Day-To-Day | Oct 17 |
| Oskar Back, C | Injured Reserve | Oct 16 |
| David Perron, LW | Out | Oct 16 |
| Matt Duchene, C | Injured Reserve | Oct 12 |
| Luke Krys, D | Injured Reserve | Sep 29 |
 San Jose Sharks Injuries
| NAME, POS | STATUS | DATE |
|---|---|---|
| Quentin Musty, LW | Injured Reserve | Sep 28 |
| Kyle Keyser, G | Injured Reserve | Sep 28 |
Game Information
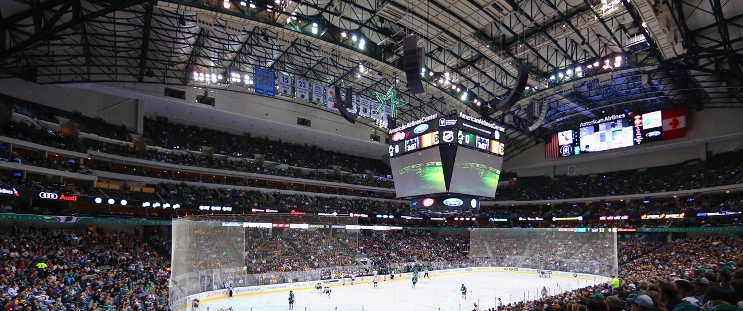 American Airlines Center
Location: Dallas, TX
Capacity:
American Airlines Center
Location: Dallas, TX
Capacity:








Full Standings








 BOS
 DET
 BUF
 PIT