
Milwaukee Brewers at San Diego Padres
· NLDS - Game 4
3 - 1

Brewers eliminate Padres with 3-1 win in Game 4, advance to NLCS rematch with Dodgers

Mitchell also drove in Sal Frelick with Milwaukee’s first run as the Brewers snapped their 12-game postseason road losing streak since 2018 and reached the team's fifth League Championship Series.
Machado nearly tied Game 4 with a 406-foot drive off reliever Abner Uribe, but Mitchell coolly tracked it down and reached just above the short wall in right-center to keep it in the yard.
Second baseman Brice Turang then ended the eighth with an acrobatic catch of Ty France’s tailing popup in foul ground.
After fending off the surging Padres in four tight games decided by a combined five runs, the 103-win Brewers will get an NLCS rematch with Los Angeles Dodgers, who eliminated Atlanta on Wednesday.
The Dodgers swept Milwaukee last October on the way to their second consecutive World Series title.
Fernando Tatis Jr. hit a 429-foot homer on an otherwise tepid offensive night for the Padres, who repeatedly tested the majors’ best regular-season team before falling short of only the fourth NLCS appearance in team history.
One night after the Padres avoided elimination in Game 3, Milwaukee claimed its first road playoff win since the 2018 NLCS by sticking to its season-long formula for success.
While four Brewers pitchers combined on a three-hitter and the defense made nearly every big play, Milwaukee’s lineup calmly worked counts, pounded 10 hits through the Padres' defense and manufactured enough runs to head home smiling.
Jackson Chourio capped his high-impact series by driving in Mitchell to become the Brewers’ career leader in postseason RBI at just 22 years old. Chourio has 17 RBI, including six in this series, in 16 playoff games.
Milwaukee opened the scoring in the third when Frelick reached on an infield single, stole second and came around on a single by Mitchell, an Orange County native and UCLA product.
Brewers starter and former Padres draft pick Robert Gasser threw four innings of three-hit ball, but Tatis ended his 1-for-19 skid since San Diego's playoff opener with a long shot to center in the third. It was the longest homer ever hit in the postseason at Petco Park by a San Diego player.
Padres starter Walker Buehler yielded just three hits and a run, but manager Craig Stammen replaced him with Game 1 starter Robbie Ray after William Contreras’ leadoff single in the fourth.
Mitchell then stroked a mild liner perfectly over first base and into the right-field corner leading off the fifth, and he scored on Chourio's single through the drawn-in infield. Chourio surpassed Ryan Braun for the most postseason RBI in Brewers history.
Jake Bauers singled leading off the sixth and went to third on Cooper Pratt's ground-rule double before scoring on Frelick's sacrifice fly.
The Padres were already down 3-1 in the seventh when Mason Miller allowed three baserunners, but no runs. The vaunted closer missed Game 3 for the birth of his first child.
After sitting below .500 and in 11th place in the NL in late July, San Diego roared into the first wild-card spot and then swept the Cubs in the Wild Card Series last week. The Padres had won 19 of 22 before losing three of four to Milwaukee.
See AP’s full MLB coverage here
How can I watch Milwaukee Brewers vs. San Diego Padres?
- TV Channel: Brewers at Padres 2022 MLB Baseball, is broadcasted on FS1.
- Online streaming: Sign up for Fubo.
Scoring Summary
 |
9th Inning | Sheets struck out swinging. |
|
9th Inning | Sheets hit for Campusano |
|
9th Inning | Bogaerts grounded out to third. |
|
9th Inning | Salas struck out swinging. |
 |
9th Inning | Megill relieved Uribe |
|
9th Inning | Salas hit for Hays |
Statistics
 MIL MIL |
 SD SD |
|
|---|---|---|
| 1 | Games Played | 1 |
| 1 | Team Games Played | 1 |
| 1 | Hit By Pitch | 0 |
| 16 | Ground Balls | 12 |
| 3 | Strikeouts | 9 |
| 3 | Runs Batted In | 1 |
| 0 | Sacrifice Hit | 0 |
| 10 | Hits | 3 |
| 2 | Stolen Bases | 0 |
| 4 | Walks | 4 |
| 0 | Catcher Interference | 0 |
| 3 | Runs | 1 |
| 2 | Ground Into Double Play | 1 |
| 1 | Sacrifice Flies | 0 |
| 34 | At Bats | 30 |
| 0 | Home Runs | 1 |
| 0 | Grand Slam Home Runs | 0 |
| 20 | Runners Left On Base | 11 |
| 1 | Triples | 0 |
| 1 | Game Winning RBIs | 0 |
| 0 | Intentional Walks | 0 |
| 1 | Doubles | 0 |
| 16 | Fly Balls | 9 |
| 0 | Caught Stealing | 0 |
| 148 | Pitches | 126 |
| 0 | Games Started | 0 |
| 0 | Pinch At Bats | 2 |
| 0 | Pinch Hits | 0 |
| 0.0 | Player Rating | 0.0 |
| 1 | Is Qualified | 1 |
| 1 | Is Qualified In Steals | 0 |
| 13 | Total Bases | 6 |
| 40 | Plate Appearances | 34 |
| 0.0 | Projected Home Runs | 162.0 |
| 2 | Extra Base Hits | 1 |
| 5.2 | Runs Created | 0.5 |
| .294 | Batting Average | .100 |
| .000 | Pinch Hit Average | .000 |
| .382 | Slugging Percentage | .200 |
| .265 | Secondary Average | .233 |
| .375 | On Base Percentage | .206 |
| .757 | OBP Pct + SLG Pct | .406 |
| 1.0 | Ground To Fly Ball Ratio | 1.3 |
| 5.2 | Runs Created Per 27 Outs | 0.5 |
| 28.5 | Batter Rating | 10.0 |
| 0.0 | At Bats Per Home Run | 30.0 |
| 1.00 | Stolen Base Percentage | 0.00 |
| 3.70 | Pitches Per Plate Appearance | 3.71 |
| .088 | Isolated Power | .100 |
| 1.33 | Walk To Strikeout Ratio | 0.44 |
| .100 | Walks Per Plate Appearance | .118 |
| -.029 | Secondary Average Minus Batting Average | .133 |
| 6.0 | Runs Produced | 2.0 |
| 1.0 | Runs Ratio | 1.0 |
| 0.5 | Patience Ratio | 0.3 |
| 0.3 | Balls In Play Average | 0.1 |
| 83.3 | MLB Rating | 62.0 |
| 0.0 | Offensive Wins Above Replacement | 0.0 |
| 0.0 | Wins Above Replacement | 0.0 |
Game Information
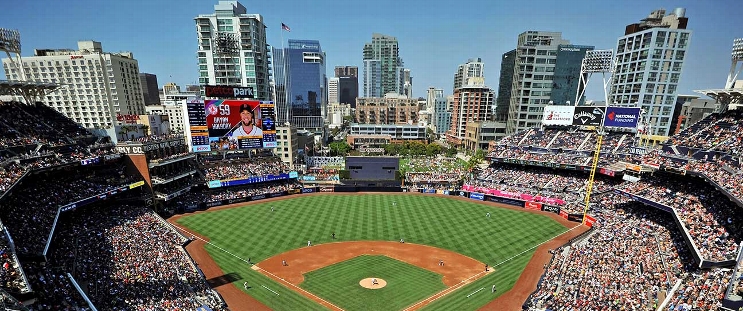
Location: San Diego, California
Attendance: 47,712 | Capacity:
2026 National League Central Standings
| TEAM | W | L | PCT | GB | STRK |
|---|---|---|---|---|---|
| Milwaukee |
- | 59 | W5 | 0.63580245 | 103 |
 Chicago Chicago |
14 | 73 | W1 | 0.5493827 | 89 |
 Pittsburgh Pittsburgh |
21 | 80 | W1 | 0.50617284 | 82 |
 St. Louis St. Louis |
26 | 85 | L4 | 0.47530866 | 77 |
 Cincinnati Cincinnati |
28 | 87 | L1 | 0.46296296 | 75 |
2026 National League West Standings
| TEAM | W | L | PCT | GB | STRK |
|---|---|---|---|---|---|
 Los Angeles Los Angeles |
- | 62 | W3 | 0.61728394 | 100 |
| San Diego |
9 | 71 | W2 | 0.5617284 | 91 |
 Arizona Arizona |
14 | 76 | L2 | 0.5308642 | 86 |
 San Francisco San Francisco |
35 | 97 | L5 | 0.40123457 | 65 |
 Colorado Colorado |
42 | 104 | L1 | 0.3580247 | 58 |