
Arizona Diamondbacks at St. Louis Cardinals
· Makeup from June 25
10 - 6

Locklear, Pdaadt help the Diamondbacks beat the Cardinals 10-6

Arizona had 16 hits in the makeup of the teams’ June 25 rainout a day after having a season-high 17 hits at home against the Athletics.
Pfaadt (5-1) allowed two first-inning runs on four straight hits leading off the game but settled in to allow just three more hits. Arizona who has won three straight and nine of 11.
The Cardinals scored four two-out runs off Ryan Thompson in the ninth inning.
Locklear lined an RBI single up the middle off Matt Svanson in the eighth inning after hitting a two-run homer, his first of the season, off Michael McGreevy (4-8) in the fourth inning.
Arizona sent 11 batters to the plate in the eighth inning and scored five runs off Svanson and Justin Bruihl.
McGreevy (4-8) allowed four runs on seven hits in 6 1/3 innings for St. Louis. The Cardinals have lost 11 of 16.
Jordan Walker received a standing ovation before his first home plate appearance since winning the 2026 Home Run Derby and lined an RBI double on the first pitch he saw to give St. Louis a 1-0 lead.
Ketel Marte was scratched less than an hour before first pitch with back stiffness after originally being slated to leadoff and play second base for Arizona.
Iván Herrera had the day off for St. Louis after starting each of the club’s first 101 games.
How can I watch Arizona Diamondbacks vs. St. Louis Cardinals?
- TV Channel: Diamondbacks at Cardinals 2022 MLB Baseball, is broadcasted on MLB.TV.
- Online streaming: Sign up for Fubo.
Scoring Summary
 |
9th Inning | Winn grounded out to second. |
|
9th Inning | Nootbaar singled to right, Torres scored and Burleson scored. |
|
9th Inning | Burleson doubled to right, Torres to third. |
|
9th Inning | Torres singled to right, Church scored and Wetherholt scored. |
|
9th Inning | Wetherholt to second on wild pitch by Thompson, Church to third on wild pitch by Thompson. |
|
9th Inning | Torres hit for Walker |
Statistics
 ARI |
 STL |
|
|---|---|---|
| 1 | Games Played | 1 |
| 1 | Team Games Played | 1 |
| 0 | Hit By Pitch | 0 |
| 13 | Ground Balls | 18 |
| 6 | Strikeouts | 2 |
| 10 | Runs Batted In | 6 |
| 0 | Sacrifice Hit | 0 |
| 16 | Hits | 13 |
| 1 | Stolen Bases | 0 |
| 5 | Walks | 2 |
| 0 | Catcher Interference | 0 |
| 10 | Runs | 6 |
| 2 | Ground Into Double Play | 1 |
| 3 | Sacrifice Flies | 0 |
| 38 | At Bats | 39 |
| 1 | Home Runs | 0 |
| 0 | Grand Slam Home Runs | 0 |
| 19 | Runners Left On Base | 20 |
| 1 | Triples | 0 |
| 1 | Game Winning RBIs | 0 |
| 0 | Intentional Walks | 0 |
| 3 | Doubles | 3 |
| 22 | Fly Balls | 19 |
| 0 | Caught Stealing | 0 |
| 177 | Pitches | 133 |
| 0 | Games Started | 0 |
| 1 | Pinch At Bats | 2 |
| 1 | Pinch Hits | 1 |
| 0.0 | Player Rating | 0.0 |
| 1 | Is Qualified | 1 |
| 1 | Is Qualified In Steals | 0 |
| 24 | Total Bases | 16 |
| 46 | Plate Appearances | 41 |
| 162.0 | Projected Home Runs | 0.0 |
| 5 | Extra Base Hits | 3 |
| 10.3 | Runs Created | 5.6 |
| .421 | Batting Average | .333 |
| 1.000 | Pinch Hit Average | .500 |
| .632 | Slugging Percentage | .410 |
| .368 | Secondary Average | .128 |
| .457 | On Base Percentage | .366 |
| 1.088 | OBP Pct + SLG Pct | .776 |
| 0.6 | Ground To Fly Ball Ratio | 0.9 |
| 10.3 | Runs Created Per 27 Outs | 5.6 |
| 68.5 | Batter Rating | 43.0 |
| 38.0 | At Bats Per Home Run | 0.0 |
| 1.00 | Stolen Base Percentage | 0.00 |
| 3.85 | Pitches Per Plate Appearance | 3.24 |
| .211 | Isolated Power | .077 |
| 0.83 | Walk To Strikeout Ratio | 1.00 |
| .109 | Walks Per Plate Appearance | .049 |
| -.053 | Secondary Average Minus Batting Average | -.205 |
| 20.0 | Runs Produced | 12.0 |
| 1.0 | Runs Ratio | 1.0 |
| 0.7 | Patience Ratio | 0.4 |
| 0.5 | Balls In Play Average | 0.4 |
| 114.3 | MLB Rating | 93.5 |
| 0.0 | Offensive Wins Above Replacement | 0.0 |
| 0.0 | Wins Above Replacement | 0.0 |
Game Information
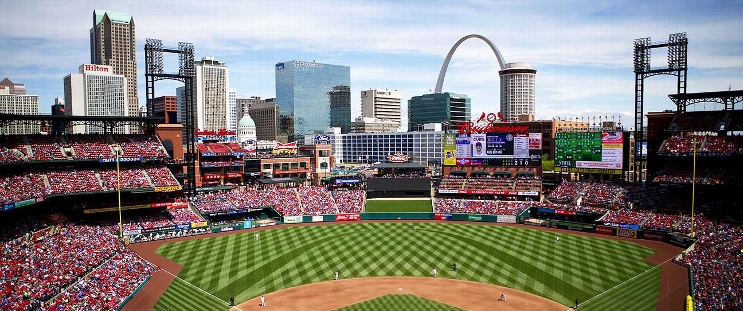
Location: St. Louis, Missouri
Attendance: 32,381 | Capacity:
2026 National League West Standings
| TEAM | W | L | PCT | GB | STRK |
|---|---|---|---|---|---|
 Los Angeles |
- | 62 | W3 | 0.61728394 | 100 |
 San Diego |
9 | 71 | W2 | 0.5617284 | 91 |
| Arizona |
14 | 76 | L2 | 0.5308642 | 86 |
 San Francisco |
35 | 97 | L5 | 0.40123457 | 65 |
 Colorado |
42 | 104 | L1 | 0.3580247 | 58 |
2026 National League Central Standings
| TEAM | W | L | PCT | GB | STRK |
|---|---|---|---|---|---|
 Milwaukee |
- | 59 | W5 | 0.63580245 | 103 |
 Chicago |
14 | 73 | W1 | 0.5493827 | 89 |
 Pittsburgh |
21 | 80 | W1 | 0.50617284 | 82 |
| St. Louis |
26 | 85 | L4 | 0.47530866 | 77 |
 Cincinnati |
28 | 87 | L1 | 0.46296296 | 75 |