
Texas Rangers at Minnesota Twins
· Major League Baseball
4 - 6

Rangers eliminated from postseason contention on final day with 6-4 loss to Twins

Texas (80-82) needed a win and a Houston loss to the Athletics. The Astros (81-81), who held the division tiebreaker, beat the Athletics 9-0.
Minnesota finished 77-85, a seven-win improvement in manager Derek Shelton's first season.
Kremer (5-5) gave up three hits, retiring 15 of his last 16 hitters. He went 4-1 with a 3.48 ERA in 10 starts after the Twins acquired him from Baltimore on Aug. 1.
Bell's first-inning sacrifice fly fly was offset by Danny Jansen's third-inning solo homer for the Rangers. Bell put the Twins ahead for good at 3-1 with a two-run homer off reliever Chase Silseth (0-2).
Texas used six pitchers through the first five innings as manager Skip Schumaker tried to exploit matchup advantages, but the Twins stretched their lead to 5-1 in the fifth. Walker Jenkins led off with a single against Tyler Alexander. Jakob Junis then entered the game and walked three of the next four hitters, forcing in a run.
Kody Clemens greeted Jordan Montgomery with an RBI single.
Elias Diaz homered off A.J. Minter in the eighth, but Royce Lewis hit a solo homer in the bottom half.
Corey Seager hit his 20th home run of the year, a two-run shot off Andrew Morris, in the ninth.
How can I watch Texas Rangers vs. Minnesota Twins?
- TV Channel: Rangers at Twins 2022 MLB Baseball, is broadcasted on MLB.TV.
- Online streaming: Sign up for Fubo.
Scoring Summary
 |
9th Inning | Duran flied out to left. |
|
9th Inning | Burger struck out swinging. |
|
9th Inning | Seager homered to right center (387 feet), Nimmo scored. |
|
9th Inning | Langford popped out to second. |
|
9th Inning | Nimmo singled to center. |
 |
9th Inning | Morris relieved Minter |
Statistics
 TEX |
 MIN |
|
|---|---|---|
| 1 | Games Played | 1 |
| 1 | Team Games Played | 1 |
| 0 | Hit By Pitch | 1 |
| 8 | Ground Balls | 6 |
| 5 | Strikeouts | 6 |
| 4 | Runs Batted In | 6 |
| 1 | Sacrifice Hit | 0 |
| 6 | Hits | 10 |
| 0 | Stolen Bases | 1 |
| 0 | Walks | 5 |
| 0 | Catcher Interference | 0 |
| 4 | Runs | 6 |
| 1 | Ground Into Double Play | 0 |
| 0 | Sacrifice Flies | 1 |
| 31 | At Bats | 31 |
| 3 | Home Runs | 2 |
| 0 | Grand Slam Home Runs | 0 |
| 4 | Runners Left On Base | 19 |
| 0 | Triples | 0 |
| 0 | Game Winning RBIs | 1 |
| 0 | Intentional Walks | 0 |
| 0 | Doubles | 1 |
| 19 | Fly Balls | 20 |
| 0 | Caught Stealing | 2 |
| 99 | Pitches | 138 |
| 0 | Games Started | 0 |
| 3 | Pinch At Bats | 0 |
| 1 | Pinch Hits | 0 |
| 0.0 | Player Rating | 0.0 |
| 1 | Is Qualified | 1 |
| 0 | Is Qualified In Steals | 1 |
| 15 | Total Bases | 17 |
| 32 | Plate Appearances | 38 |
| 486.0 | Projected Home Runs | 324.0 |
| 3 | Extra Base Hits | 3 |
| 2.8 | Runs Created | 6.9 |
| .194 | Batting Average | .323 |
| .333 | Pinch Hit Average | .000 |
| .484 | Slugging Percentage | .548 |
| .290 | Secondary Average | .355 |
| .194 | On Base Percentage | .421 |
| .677 | OBP Pct + SLG Pct | .969 |
| 0.4 | Ground To Fly Ball Ratio | 0.3 |
| 2.8 | Runs Created Per 27 Outs | 7.7 |
| 31.0 | Batter Rating | 43.0 |
| 10.3 | At Bats Per Home Run | 15.5 |
| 0.00 | Stolen Base Percentage | 0.33 |
| 3.09 | Pitches Per Plate Appearance | 3.63 |
| .290 | Isolated Power | .226 |
| 0.00 | Walk To Strikeout Ratio | 0.83 |
| .000 | Walks Per Plate Appearance | .132 |
| .097 | Secondary Average Minus Batting Average | .032 |
| 8.0 | Runs Produced | 12.0 |
| 1.0 | Runs Ratio | 1.0 |
| 0.5 | Patience Ratio | 0.6 |
| 0.1 | Balls In Play Average | 0.3 |
| 80.8 | MLB Rating | 92.8 |
| 0.0 | Offensive Wins Above Replacement | 0.0 |
| 0.0 | Wins Above Replacement | 0.0 |
Game Information
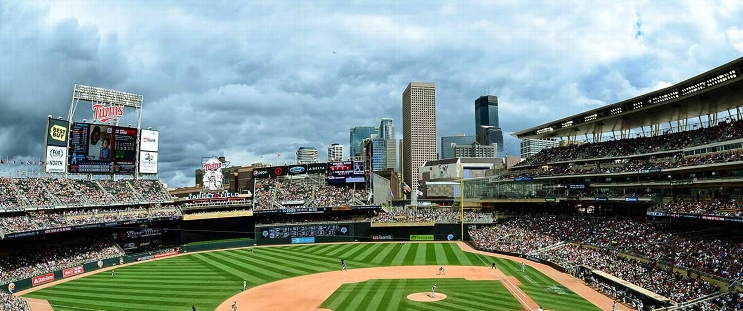
Location: Minneapolis, Minnesota
Attendance: 26,839 | Capacity:
2026 American League West Standings
| TEAM | W | L | PCT | GB | STRK |
|---|---|---|---|---|---|
 Houston |
- | 81 | W2 | 0.5 | 81 |
| Texas |
1 | 82 | L1 | 0.49382716 | 80 |
 Seattle |
5 | 86 | W2 | 0.4691358 | 76 |
 Athletics |
17 | 98 | L2 | 0.39506173 | 64 |
 Los Angeles |
19 | 100 | L2 | 0.38271606 | 62 |
2026 American League Central Standings
| TEAM | W | L | PCT | GB | STRK |
|---|---|---|---|---|---|
 Cleveland |
- | 77 | L1 | 0.52469134 | 85 |
 Chicago |
1 | 78 | W1 | 0.5185185 | 84 |
| Minnesota |
8 | 85 | W1 | 0.47530866 | 77 |
 Detroit |
9 | 86 | L1 | 0.4691358 | 76 |
 Kansas City |
16 | 93 | W1 | 0.42592594 | 69 |