
Cincinnati Reds at Toronto Blue Jays
· Major League Baseball
5 - 6

Lukes has go-ahead hit in four-run seventh, Okamoto drives in three as Blue Jays beat Reds 6-5

Cincinnati’s Elly De La Cruz stole third base in the third inning to become the fourth player in Reds history with at least 30 home runs and 30 stolen bases in the same season.
De La Cruz, who started at DH on Friday, hit his 30th home run in Thursday’s 7-6 win at Atlanta.
Mason Fluharty (7-1) got two outs for the win and Louis Varland worked a 1-2-3 ninth against the top of the lineup for his 35th save in 37 chances.
Alejandro Kirk and Okamoto hit RBI doubles off Nick Lodolo in the first. Cincinnati’s Eugenio Suárez hit a home run in the second to make it 2-1.
The Reds chased José Soriano with a four-run third. De La Cruz hit a two-run double, stole third and scored on Sal Stewart’s single. Héctor Rodríguez drove in the fourth run with a fielder’s choice.
Soriano allowed five runs and eight hits.
Toronto's seventh began with back-to-back walks issued by Luis Mey (0-2).
Vladimir Guerrero Jr. followed with an RBI single, a hit that was redirected when the bouncing ball was struck by a flying piece of Guerrero’s broken bat.
After George Springer reached on Oswaldo Cabrera’s fielding error, Pierce Johnson replaced Mey. Okamoto greeted Johnson with a tying double to center and Lukes followed with his RBI single.
Before the game, Guerrero apologized for recent comments about his 14-year, $500 million contract. He finished 1 for 5.
----
See AP’s full MLB coverage here
How can I watch Cincinnati Reds vs. Toronto Blue Jays?
- TV Channel: Reds at Blue Jays 2022 MLB Baseball, is broadcasted on MLB.TV.
- Online streaming: Sign up for Fubo.
Scoring Summary
 |
9th Inning | Stewart struck out swinging. |
|
9th Inning | De La Cruz grounded out to second. |
|
9th Inning | Jorge struck out looking. |
 |
9th Inning | Varland relieved Rogers |
|
9th Inning | Valenzuela catching. |
|
8th Inning | Springer flied out to center. |
Statistics
 CIN |
 TOR |
|
|---|---|---|
| 1 | Games Played | 1 |
| 1 | Team Games Played | 1 |
| 0 | Hit By Pitch | 2 |
| 15 | Ground Balls | 13 |
| 11 | Strikeouts | 6 |
| 5 | Runs Batted In | 6 |
| 0 | Sacrifice Hit | 0 |
| 12 | Hits | 10 |
| 1 | Stolen Bases | 0 |
| 1 | Walks | 5 |
| 0 | Catcher Interference | 0 |
| 5 | Runs | 6 |
| 1 | Ground Into Double Play | 2 |
| 0 | Sacrifice Flies | 0 |
| 38 | At Bats | 33 |
| 1 | Home Runs | 0 |
| 0 | Grand Slam Home Runs | 0 |
| 16 | Runners Left On Base | 25 |
| 0 | Triples | 0 |
| 0 | Game Winning RBIs | 1 |
| 0 | Intentional Walks | 0 |
| 1 | Doubles | 5 |
| 12 | Fly Balls | 14 |
| 0 | Caught Stealing | 0 |
| 141 | Pitches | 154 |
| 0 | Games Started | 0 |
| 0 | Pinch At Bats | 2 |
| 0 | Pinch Hits | 0 |
| 0.0 | Player Rating | 0.0 |
| 1 | Is Qualified | 1 |
| 1 | Is Qualified In Steals | 0 |
| 16 | Total Bases | 15 |
| 39 | Plate Appearances | 40 |
| 162.0 | Projected Home Runs | 0.0 |
| 2 | Extra Base Hits | 5 |
| 5.1 | Runs Created | 6.1 |
| .316 | Batting Average | .303 |
| .000 | Pinch Hit Average | .000 |
| .421 | Slugging Percentage | .455 |
| .158 | Secondary Average | .303 |
| .333 | On Base Percentage | .425 |
| .754 | OBP Pct + SLG Pct | .880 |
| 1.3 | Ground To Fly Ball Ratio | 0.9 |
| 5.1 | Runs Created Per 27 Outs | 6.6 |
| 38.0 | Batter Rating | 44.0 |
| 38.0 | At Bats Per Home Run | 0.0 |
| 1.00 | Stolen Base Percentage | 0.00 |
| 3.62 | Pitches Per Plate Appearance | 3.85 |
| .105 | Isolated Power | .152 |
| 0.09 | Walk To Strikeout Ratio | 0.83 |
| .026 | Walks Per Plate Appearance | .125 |
| -.158 | Secondary Average Minus Batting Average | .000 |
| 10.0 | Runs Produced | 12.0 |
| 1.0 | Runs Ratio | 1.0 |
| 0.4 | Patience Ratio | 0.6 |
| 0.4 | Balls In Play Average | 0.4 |
| 88.3 | MLB Rating | 90.5 |
| 0.0 | Offensive Wins Above Replacement | 0.0 |
| 0.0 | Wins Above Replacement | 0.0 |
Game Information
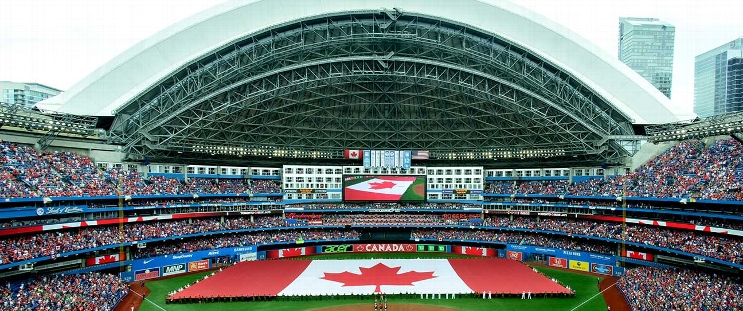
Location: Toronto, Ontario
Attendance: 42,535 | Capacity:
2026 National League Central Standings
| TEAM | W | L | PCT | GB | STRK |
|---|---|---|---|---|---|
 Milwaukee |
- | 59 | W5 | 0.63580245 | 103 |
 Chicago |
14 | 73 | W1 | 0.5493827 | 89 |
 Pittsburgh |
21 | 80 | W1 | 0.50617284 | 82 |
 St. Louis |
26 | 85 | L4 | 0.47530866 | 77 |
| Cincinnati |
28 | 87 | L1 | 0.46296296 | 75 |
2026 American League East Standings
| TEAM | W | L | PCT | GB | STRK |
|---|---|---|---|---|---|
 Tampa Bay |
- | 64 | L1 | 0.60493827 | 98 |
 New York |
4.5 | 68 | W1 | 0.57763976 | 93 |
 Boston |
11 | 75 | L1 | 0.537037 | 87 |
 Baltimore |
18.5 | 82 | L1 | 0.49068323 | 79 |
| Toronto |
19 | 83 | W1 | 0.48765433 | 79 |