
Minnesota Twins at San Francisco Giants
· Major League Baseball
4 - 2

Walker Jenkins' pinch-hit RBI single in the 7th keys Twins' 4-2 victory over Giants

The score was 2-all with Kody Clemens at second and one out in the seventh. Jenkins delivered a base hit to right off Dylan Smith (0-6) that scored Clemens for a 3-2 Minnesota lead. With two outs, Josh Bell added an RBI single off Sam Hentges to increase the Twins’ edge to 4-2.
Yoendrys Gomez (3-4) retired all five hitters he faced to earn the win. Andrew Morris worked a scoreless ninth for his fifth save. He struck out Shay Whitcomb with runners at first and second to end the game.
Minnesota got on the board first when Luke Keaschall took Cesar Perdomo deep to left for a solo homer in the third inning. It was Keaschall’s 10th homer of the season.
The Giants scored both of their runs with two outs in the fourth on Whitcomb’s pop-fly single that fell just fair near the right-field line. It gave San Francisco a 2-1 advantage.
The Twins tied it in the fifth on Keaschall’s sacrifice fly that scored Ben Ross, who had tripled.
Perdomo, a rookie left-hander, gave up two runs on five hits in 5 1/3 innings. He struck out two and did not issue a walk.
Minnesota starter Connor Prielipp, also a rookie left-hander, allowed two runs on four hits in 5 1/3 innings. He struck out three and walked two.
With the loss, the Giants fell to 37-41 at home, meaning they will have a losing record for the season at Oracle Park.
Giants RHP Yunior Marte (0-1, 4.66) takes on the visiting Dodgers on Friday night.
See AP’s full MLB coverage here
How can I watch Minnesota Twins vs. San Francisco Giants?
- TV Channel: Twins at Giants 2022 MLB Baseball, is broadcasted on MLB.TV.
- Online streaming: Sign up for Fubo.
Scoring Summary
 |
9th Inning | Whitcomb struck out swinging. |
|
9th Inning | Bandura ran for Mayer |
|
9th Inning | Mayer walked. Minnesota Twins challenged: call on the field was upheld. |
|
9th Inning | Gilbert to second on fielder's indifference. |
|
9th Inning | Gilbert singled to right. |
|
9th Inning | Gilbert hit for B. Harris |
Statistics
 MIN |
 SF |
|
|---|---|---|
| 1 | Games Played | 1 |
| 1 | Team Games Played | 1 |
| 0 | Hit By Pitch | 0 |
| 14 | Ground Balls | 12 |
| 6 | Strikeouts | 7 |
| 4 | Runs Batted In | 2 |
| 0 | Sacrifice Hit | 0 |
| 9 | Hits | 5 |
| 0 | Stolen Bases | 0 |
| 3 | Walks | 3 |
| 0 | Catcher Interference | 0 |
| 4 | Runs | 2 |
| 0 | Ground Into Double Play | 0 |
| 1 | Sacrifice Flies | 0 |
| 35 | At Bats | 32 |
| 1 | Home Runs | 0 |
| 0 | Grand Slam Home Runs | 0 |
| 12 | Runners Left On Base | 9 |
| 1 | Triples | 0 |
| 1 | Game Winning RBIs | 0 |
| 0 | Intentional Walks | 0 |
| 0 | Doubles | 1 |
| 16 | Fly Balls | 13 |
| 0 | Caught Stealing | 0 |
| 159 | Pitches | 131 |
| 0 | Games Started | 0 |
| 2 | Pinch At Bats | 2 |
| 1 | Pinch Hits | 1 |
| 0.0 | Player Rating | 0.0 |
| 1 | Is Qualified | 1 |
| 0 | Is Qualified In Steals | 0 |
| 14 | Total Bases | 6 |
| 39 | Plate Appearances | 35 |
| 162.0 | Projected Home Runs | 0.0 |
| 2 | Extra Base Hits | 1 |
| 4.7 | Runs Created | 1.1 |
| .257 | Batting Average | .156 |
| .500 | Pinch Hit Average | .500 |
| .400 | Slugging Percentage | .188 |
| .229 | Secondary Average | .125 |
| .308 | On Base Percentage | .229 |
| .708 | OBP Pct + SLG Pct | .416 |
| 0.9 | Ground To Fly Ball Ratio | 0.9 |
| 4.7 | Runs Created Per 27 Outs | 1.1 |
| 30.5 | Batter Rating | 15.0 |
| 35.0 | At Bats Per Home Run | 0.0 |
| 0.00 | Stolen Base Percentage | 0.00 |
| 4.08 | Pitches Per Plate Appearance | 3.74 |
| .143 | Isolated Power | .031 |
| 0.50 | Walk To Strikeout Ratio | 0.43 |
| .077 | Walks Per Plate Appearance | .086 |
| -.029 | Secondary Average Minus Batting Average | -.031 |
| 8.0 | Runs Produced | 4.0 |
| 1.0 | Runs Ratio | 1.0 |
| 0.5 | Patience Ratio | 0.3 |
| 0.3 | Balls In Play Average | 0.2 |
| 83.0 | MLB Rating | 66.3 |
| 0.0 | Offensive Wins Above Replacement | 0.0 |
| 0.0 | Wins Above Replacement | 0.0 |
Game Information
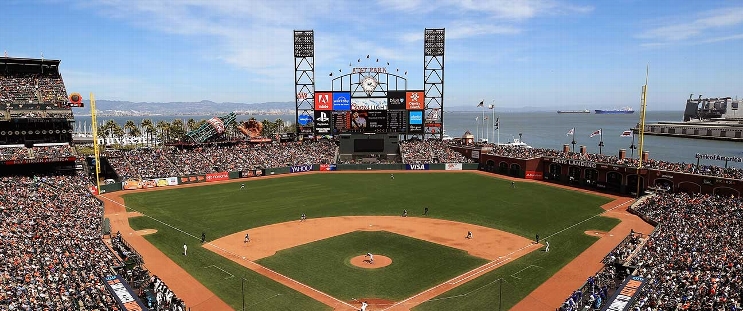
Location: San Francisco, California
Attendance: 28,136 | Capacity:
2026 American League Central Standings
| TEAM | W | L | PCT | GB | STRK |
|---|---|---|---|---|---|
 Cleveland |
- | 77 | L1 | 0.52469134 | 85 |
 Chicago |
1 | 78 | W1 | 0.5185185 | 84 |
| Minnesota |
8 | 85 | W1 | 0.47530866 | 77 |
 Detroit |
9 | 86 | L1 | 0.4691358 | 76 |
 Kansas City |
16 | 93 | W1 | 0.42592594 | 69 |
2026 National League West Standings
| TEAM | W | L | PCT | GB | STRK |
|---|---|---|---|---|---|
 Los Angeles |
- | 62 | W3 | 0.61728394 | 100 |
 San Diego |
9 | 71 | W2 | 0.5617284 | 91 |
 Arizona |
14 | 76 | L2 | 0.5308642 | 86 |
| San Francisco |
35 | 97 | L5 | 0.40123457 | 65 |
 Colorado |
42 | 104 | L1 | 0.3580247 | 58 |