
Cleveland Guardians at Boston Red Sox
· Major League Baseball
3 - 2

Lowe's sacrifice fly breaks tie and lifts Guardians past Red Sox, 3-2, helping them atop AL Central

Angel Martínez had three hits for the Guardians, who hold a one-game lead over the White Sox atop the Central and have won six straight. Chicago, which won 14-11 over Kansas City, owns the tiebreaker by winning the season series. Cleveland stranded a season-high for a nine-inning game of 15 baserunners.
The loss was Boston’s eighth in 12 games, spoiling Chad Tracy’s first game as manager after the club named him its 49th in team history.
Adley Rutschman added three hits for Boston, which clinched one of the AL’s wild-card spots Sunday.
Boston pinch hitter Mickey Gasper hit Hunter Gaddis’ first pitch, tying it at 2-2 leading off the eighth.
Gaddis (5-3) got the win and Cade Smith the final three outs for his 40th save.
Miller (4-2) hit a batter and gave up two hits in an inning.
A strong candidate for the AL Rookie of the Year, Cleveland left-hander Parker Messick gave up a run over five innings. He lowered his ERA to 2.55 and is on pace to become the fourth rookie starting pitcher in MLB history with an ERA under 2.60 and averaging 9.0 or more strikeouts per nine innings.
In his tune-up for a likely playoff start next week, Boston lefty Payton Tolle struggled with his control over 5 2/3 innings, giving up two runs on eight hits. In his previous start on Sept. 13, he had Boston’s second recorded immaculate inning that opened a game.
See AP’s full MLB coverage here
How can I watch Cleveland Guardians vs. Boston Red Sox?
- TV Channel: Guardians at Red Sox 2022 MLB Baseball, is broadcasted on MLB.TV.
- Online streaming: Sign up for Fubo.
Scoring Summary
 |
9th Inning | Sogard grounded out to second. |
|
9th Inning | Anthony grounded out to first, Duran to second. |
|
9th Inning | Duran walked. |
|
9th Inning | Duran hit for Eaton |
|
9th Inning | Kiner-Falefa struck out looking. Boston Red Sox challenged: call on the field was upheld. |
 |
9th Inning | Smith relieved Gaddis |
Statistics
 CLE |
 BOS |
|
|---|---|---|
| 1 | Games Played | 1 |
| 1 | Team Games Played | 1 |
| 2 | Hit By Pitch | 0 |
| 15 | Ground Balls | 10 |
| 9 | Strikeouts | 12 |
| 2 | Runs Batted In | 2 |
| 0 | Sacrifice Hit | 1 |
| 12 | Hits | 8 |
| 0 | Stolen Bases | 1 |
| 4 | Walks | 4 |
| 0 | Catcher Interference | 0 |
| 3 | Runs | 2 |
| 1 | Ground Into Double Play | 1 |
| 1 | Sacrifice Flies | 0 |
| 38 | At Bats | 33 |
| 0 | Home Runs | 1 |
| 0 | Grand Slam Home Runs | 0 |
| 30 | Runners Left On Base | 17 |
| 0 | Triples | 0 |
| 1 | Game Winning RBIs | 0 |
| 0 | Intentional Walks | 0 |
| 2 | Doubles | 4 |
| 15 | Fly Balls | 12 |
| 0 | Caught Stealing | 0 |
| 158 | Pitches | 176 |
| 0 | Games Started | 0 |
| 0 | Pinch At Bats | 1 |
| 0 | Pinch Hits | 1 |
| 0.0 | Player Rating | 0.0 |
| 1 | Is Qualified | 1 |
| 0 | Is Qualified In Steals | 1 |
| 14 | Total Bases | 15 |
| 45 | Plate Appearances | 38 |
| 0.0 | Projected Home Runs | 162.0 |
| 2 | Extra Base Hits | 5 |
| 6.0 | Runs Created | 4.9 |
| .316 | Batting Average | .242 |
| .000 | Pinch Hit Average | 1.000 |
| .368 | Slugging Percentage | .455 |
| .158 | Secondary Average | .364 |
| .400 | On Base Percentage | .324 |
| .768 | OBP Pct + SLG Pct | .779 |
| 1.0 | Ground To Fly Ball Ratio | 0.8 |
| 5.8 | Runs Created Per 27 Outs | 4.9 |
| 26.0 | Batter Rating | 28.0 |
| 0.0 | At Bats Per Home Run | 33.0 |
| 0.00 | Stolen Base Percentage | 1.00 |
| 3.51 | Pitches Per Plate Appearance | 4.63 |
| .053 | Isolated Power | .212 |
| 0.44 | Walk To Strikeout Ratio | 0.33 |
| .089 | Walks Per Plate Appearance | .105 |
| -.158 | Secondary Average Minus Batting Average | .121 |
| 5.0 | Runs Produced | 4.0 |
| 0.7 | Runs Ratio | 1.0 |
| 0.5 | Patience Ratio | 0.5 |
| 0.4 | Balls In Play Average | 0.4 |
| 83.0 | MLB Rating | 78.3 |
| 0.0 | Offensive Wins Above Replacement | 0.0 |
| 0.0 | Wins Above Replacement | 0.0 |
Game Information
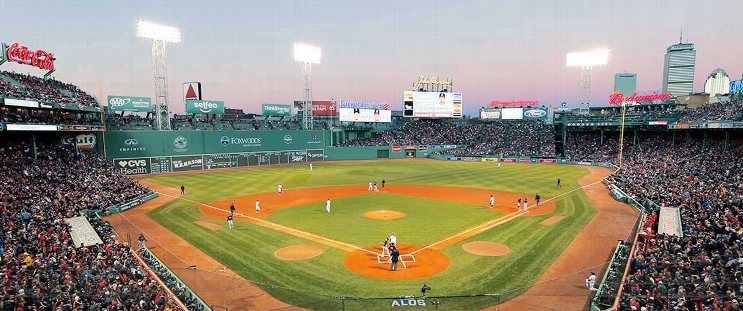
Location: Boston, Massachusetts
Attendance: 37,416 | Capacity:
2026 American League Central Standings
| TEAM | W | L | PCT | GB | STRK |
|---|---|---|---|---|---|
| Cleveland |
- | 77 | L1 | 0.52469134 | 85 |
 Chicago |
1 | 78 | W1 | 0.5185185 | 84 |
 Minnesota |
8 | 85 | W1 | 0.47530866 | 77 |
 Detroit |
9 | 86 | L1 | 0.4691358 | 76 |
 Kansas City |
16 | 93 | W1 | 0.42592594 | 69 |
2026 American League East Standings
| TEAM | W | L | PCT | GB | STRK |
|---|---|---|---|---|---|
 Tampa Bay |
- | 64 | L1 | 0.60493827 | 98 |
 New York |
4.5 | 68 | W1 | 0.57763976 | 93 |
| Boston |
11 | 75 | L1 | 0.537037 | 87 |
 Baltimore |
18.5 | 82 | L1 | 0.49068323 | 79 |
 Toronto |
19 | 83 | W1 | 0.48765433 | 79 |