
Boston Red Sox at Tampa Bay Rays
· Major League Baseball
1 - 5

Griffin Jax tosses 5 shutout innings as Rays near AL East title with a 5-1 victory over the Red Sox

The Rays will have an opportunity to clinch the franchise’s fifth division title during Tuesday’s doubleheader at the New York Yankees.
Despite the loss, the Red Sox later secured a playoff berth when the Houston Astros lost to the Atlanta Braves. The Red Sox waited out the Astros-Braves result and held a celebration in their clubhouse. The Red Sox, who were 32-46 and 15 1/2 games back in the AL East on June 24, have since gone 52-25.
Jax (8-10) allowed three singles and worked out of a bases-loaded jam in the fifth inning by striking out Roman Anthony. Cole Sulser, Brody Hopkins and Steven Matz each pitched an inning of scoreless relief.
Boston’s Trevor Story spoiled the shutout in the ninth with a one-out home run off right-hander Ty Johnson.
The Rays scored four first-inning runs off left-hander Patrick Sandoval (1-7). Jonny DeLuca smashed a two-run, bases-loaded double down the left-field line and Chandler Simpson followed with a two-run single. Sandoval began the inning by walking Yandy Diaz and Ryan Vilade, then surrendering a single to Junior Caminero.
Sandoval then retired 21 of his next 23 batters and worked through the seventh inning, allowing only a first-inning walk and a fourth-inning homer, both to Victor Mesa Jr.
See AP’s full MLB coverage here
How can I watch Boston Red Sox vs. Tampa Bay Rays?
- TV Channel: Red Sox at Rays 2022 MLB Baseball, is broadcasted on ESPN Unlmtd.
- Online streaming: Sign up for Fubo.
Scoring Summary
 |
9th Inning | Duran grounded out to shortstop. |
|
9th Inning | Durbin to second on fielder's indifference. |
 |
9th Inning | Kelly relieved Johnson |
|
9th Inning | Durbin singled to left. |
|
9th Inning | Sogard popped out to shortstop. |
|
9th Inning | Story homered to left (405 feet). |
Statistics
 BOS |
 TB |
|
|---|---|---|
| 1 | Games Played | 1 |
| 1 | Team Games Played | 1 |
| 0 | Hit By Pitch | 1 |
| 13 | Ground Balls | 10 |
| 9 | Strikeouts | 7 |
| 1 | Runs Batted In | 5 |
| 0 | Sacrifice Hit | 0 |
| 6 | Hits | 4 |
| 0 | Stolen Bases | 1 |
| 2 | Walks | 2 |
| 0 | Catcher Interference | 0 |
| 1 | Runs | 5 |
| 1 | Ground Into Double Play | 0 |
| 0 | Sacrifice Flies | 0 |
| 32 | At Bats | 28 |
| 1 | Home Runs | 1 |
| 0 | Grand Slam Home Runs | 0 |
| 11 | Runners Left On Base | 4 |
| 0 | Triples | 0 |
| 0 | Game Winning RBIs | 1 |
| 0 | Intentional Walks | 0 |
| 1 | Doubles | 1 |
| 10 | Fly Balls | 11 |
| 0 | Caught Stealing | 0 |
| 132 | Pitches | 106 |
| 0 | Games Started | 0 |
| 1 | Pinch At Bats | 0 |
| 0 | Pinch Hits | 0 |
| 0.0 | Player Rating | 0.0 |
| 1 | Is Qualified | 1 |
| 0 | Is Qualified In Steals | 1 |
| 10 | Total Bases | 8 |
| 34 | Plate Appearances | 31 |
| 162.0 | Projected Home Runs | 162.0 |
| 2 | Extra Base Hits | 2 |
| 1.9 | Runs Created | 1.9 |
| .188 | Batting Average | .143 |
| .000 | Pinch Hit Average | .000 |
| .313 | Slugging Percentage | .286 |
| .188 | Secondary Average | .250 |
| .235 | On Base Percentage | .226 |
| .548 | OBP Pct + SLG Pct | .512 |
| 1.3 | Ground To Fly Ball Ratio | 0.9 |
| 1.9 | Runs Created Per 27 Outs | 2.2 |
| 15.0 | Batter Rating | 30.0 |
| 32.0 | At Bats Per Home Run | 28.0 |
| 0.00 | Stolen Base Percentage | 1.00 |
| 3.88 | Pitches Per Plate Appearance | 3.42 |
| .125 | Isolated Power | .143 |
| 0.22 | Walk To Strikeout Ratio | 0.29 |
| .059 | Walks Per Plate Appearance | .065 |
| .000 | Secondary Average Minus Batting Average | .107 |
| 2.0 | Runs Produced | 10.0 |
| 1.0 | Runs Ratio | 1.0 |
| 0.4 | Patience Ratio | 0.4 |
| 0.2 | Balls In Play Average | 0.2 |
| 68.8 | MLB Rating | 74.3 |
| 0.0 | Offensive Wins Above Replacement | 0.0 |
| 0.0 | Wins Above Replacement | 0.0 |
Game Information
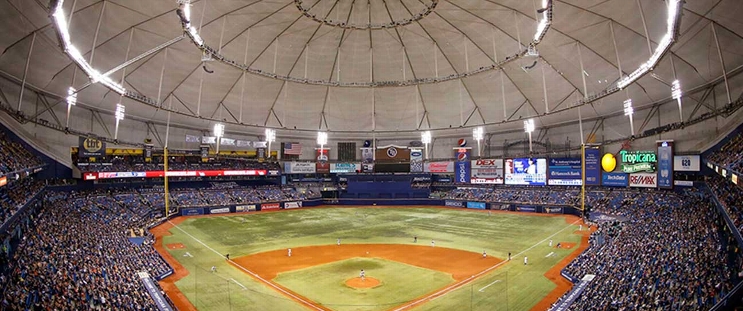
Location: St. Petersburg, Florida
Attendance: 24,654 | Capacity:
2026 American League East Standings
| TEAM | W | L | PCT | GB | STRK |
|---|---|---|---|---|---|
| Tampa Bay |
- | 64 | L1 | 0.60493827 | 98 |
 New York |
4.5 | 68 | W1 | 0.57763976 | 93 |
| Boston |
11 | 75 | L1 | 0.537037 | 87 |
 Baltimore |
18.5 | 82 | L1 | 0.49068323 | 79 |
 Toronto |
19 | 83 | W1 | 0.48765433 | 79 |