
Minnesota Twins at Los Angeles Angels
· Major League Baseball
5 - 6

Angels beat Twins 6-5 in 11 innings on Moore's bases-loaded, 2-out infield single

Vaughn Grissom hit a solo homer in the ninth off Twins reliever A.J. Minter to tie it at 5.
In the 10th with one out, the Twins Royce Lewis hit a shallow fly ball out to Angels right fielder Josh Lowe. Ben Ross tagged at third, but Lowe’s strong one-bounce throw got to catcher Moisés Ballesteros in time for a sweeping tag-out of Ross out at home to end Minnesota’s threat.
In the eighth, Angels’ pinch-hitter Adam Frazier doubled down the right-field line against reliever Yoendrys Gomez to drive in two runs to narrow the Twins’ lead to 5-4.
Angels reliever Tayler Saucedo (1-1) got the win an inning of scoreless relief. Rogers (6-4) took the loss in 1 2/3 innings of work.
Minnesota remains technically still in the race for the AL Wild Card, but has almost no chance. The Twins are at least 6 1/2 games behind five teams for the last wild-card spot with seven games remaining.
The Angels' Jose Siri hit a two-run homer in the fourth and the Twins' Ryan Kreidler launched a solo shot in the fifth.
Twins starter Joe Ryan gave up two runs and seven hits while striking out five in five innings.
Angels starting pitcher Reid Detmers lasted five innings, surrendering four runs and six hits while striking out five. He has 204 strikeouts this season, the most of any Angels pitcher since Shohei Ohtani had 219 in 2022.
See AP’s full MLB coverage here
How can I watch Minnesota Twins vs. Los Angeles Angels?
- TV Channel: Twins at Angels 2022 MLB Baseball, is broadcasted on MLB.TV.
- Online streaming: Sign up for Fubo.
Scoring Summary
 |
11th Inning | Moore reached on infield single to pitcher, Neto scored, Grissom to second, Trout to third. |
 |
11th Inning | Clemens in left field. |
|
11th Inning | Rodriguez in center field. |
|
11th Inning | Ballesteros struck out swinging. |
|
11th Inning | Clemens in center field. |
|
11th Inning | Grissom hit by pitch, Trout to second, Neto to third. |
Statistics
 MIN |
 LAA |
|
|---|---|---|
| 1 | Games Played | 1 |
| 1 | Team Games Played | 1 |
| 0 | Hit By Pitch | 3 |
| 13 | Ground Balls | 12 |
| 12 | Strikeouts | 12 |
| 5 | Runs Batted In | 6 |
| 0 | Sacrifice Hit | 0 |
| 11 | Hits | 11 |
| 1 | Stolen Bases | 3 |
| 2 | Walks | 6 |
| 0 | Catcher Interference | 0 |
| 5 | Runs | 6 |
| 0 | Ground Into Double Play | 2 |
| 0 | Sacrifice Flies | 0 |
| 43 | At Bats | 42 |
| 1 | Home Runs | 2 |
| 0 | Grand Slam Home Runs | 0 |
| 25 | Runners Left On Base | 33 |
| 0 | Triples | 0 |
| 0 | Game Winning RBIs | 1 |
| 0 | Intentional Walks | 2 |
| 3 | Doubles | 2 |
| 18 | Fly Balls | 18 |
| 0 | Caught Stealing | 0 |
| 180 | Pitches | 193 |
| 0 | Games Started | 0 |
| 1 | Pinch At Bats | 2 |
| 0 | Pinch Hits | 1 |
| 0.0 | Player Rating | 0.0 |
| 1 | Is Qualified | 1 |
| 1 | Is Qualified In Steals | 1 |
| 17 | Total Bases | 19 |
| 45 | Plate Appearances | 51 |
| 162.0 | Projected Home Runs | 324.0 |
| 4 | Extra Base Hits | 4 |
| 5.2 | Runs Created | 7.9 |
| .256 | Batting Average | .262 |
| .000 | Pinch Hit Average | .500 |
| .395 | Slugging Percentage | .452 |
| .209 | Secondary Average | .405 |
| .289 | On Base Percentage | .392 |
| .684 | OBP Pct + SLG Pct | .845 |
| 0.7 | Ground To Fly Ball Ratio | 0.7 |
| 4.3 | Runs Created Per 27 Outs | 6.5 |
| 41.0 | Batter Rating | 48.0 |
| 43.0 | At Bats Per Home Run | 21.0 |
| 1.00 | Stolen Base Percentage | 1.00 |
| 4.00 | Pitches Per Plate Appearance | 3.78 |
| .140 | Isolated Power | .190 |
| 0.17 | Walk To Strikeout Ratio | 0.50 |
| .044 | Walks Per Plate Appearance | .118 |
| -.047 | Secondary Average Minus Batting Average | .143 |
| 10.0 | Runs Produced | 12.0 |
| 1.0 | Runs Ratio | 1.0 |
| 0.4 | Patience Ratio | 0.6 |
| 0.3 | Balls In Play Average | 0.3 |
| 86.8 | MLB Rating | 93.3 |
| 0.0 | Offensive Wins Above Replacement | 0.0 |
| 0.0 | Wins Above Replacement | 0.0 |
Game Information
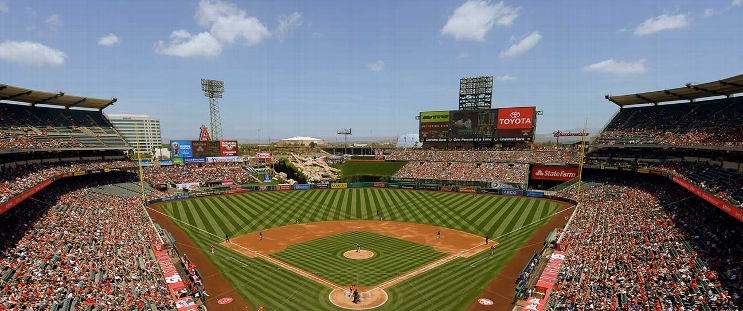
Location: Anaheim, California
Attendance: 33,726 | Capacity:
2026 American League Central Standings
| TEAM | W | L | PCT | GB | STRK |
|---|---|---|---|---|---|
 Cleveland |
- | 77 | L1 | 0.52469134 | 85 |
 Chicago |
1 | 78 | W1 | 0.5185185 | 84 |
| Minnesota |
8 | 85 | W1 | 0.47530866 | 77 |
 Detroit |
9 | 86 | L1 | 0.4691358 | 76 |
 Kansas City |
16 | 93 | W1 | 0.42592594 | 69 |
2026 American League West Standings
| TEAM | W | L | PCT | GB | STRK |
|---|---|---|---|---|---|
 Houston |
- | 81 | W2 | 0.5 | 81 |
 Texas |
1 | 82 | L1 | 0.49382716 | 80 |
 Seattle |
5 | 86 | W2 | 0.4691358 | 76 |
 Athletics |
17 | 98 | L2 | 0.39506173 | 64 |
| Los Angeles |
19 | 100 | L2 | 0.38271606 | 62 |