
Kansas City Royals at Pittsburgh Pirates
· Major League Baseball
5 - 6

Brandon Lowe's go-ahead homer in the 8th lifts the Pirates past the Royals, 6-5

Lowe jumped on a pitch from Steven Cruz (2-4) and sent it into the seats in right field for his 33rd homer of the season, the second-most by a player in their first year with the Pirates. The two-time All-Star was acquired by Pittsburgh last winter.
The home run was also the 96th at PNC Park this year for the Pirates, a club record for most homers at home in a season. The 1947 club hit 95 round-trippers when the team called Forbes Field home.
Pittsburgh rookie outfielder Ronnie Simon hit his first career homer. Jake Mangum added his fifth of the season as the Pirates won their third straight to improve to 78-77. The franchise is seeking its first winning season since 2018.
Lowe, Rafael Flores and Oneil Cruz had two hits each for the Pirates. Luke Weaver (3-1) picked up the win by pitching a scoreless eighth. Mason Montgomery worked the ninth for his 15th save. Montgomery hasn't allowed a run in 22 2/3 innings, the second-longest streak ever by a Pittsburgh reliever.
Nick Loftin had four hits for the Royals. Bobby Witt Jr. added three and Carter Jensen slugged his 25th of the season but it wasn't enough to prevent the Royals from losing for the sixth time in seven games.
Pirates starting pitcher Bubba Chandler needed 90 pitches to get through four innings. The 24-year-old right-hander allowed three runs with a walk and six strikeouts.
See AP’s full MLB coverage here
How can I watch Kansas City Royals vs. Pittsburgh Pirates?
- TV Channel: Royals at Pirates 2022 MLB Baseball, is broadcasted on MLB.TV.
- Online streaming: Sign up for Fubo.
Scoring Summary
 |
9th Inning | Loftin fouled out to catcher. |
|
9th Inning | Garcia flied out to right. |
|
9th Inning | Garcia hit for Massey |
|
9th Inning | Perez struck out swinging. |
|
9th Inning | Tolbert stole second. |
|
9th Inning | Perez hit for Pasquantino |
Statistics
 KC |
 PIT |
|
|---|---|---|
| 1 | Games Played | 1 |
| 1 | Team Games Played | 1 |
| 1 | Hit By Pitch | 1 |
| 10 | Ground Balls | 10 |
| 12 | Strikeouts | 7 |
| 5 | Runs Batted In | 6 |
| 1 | Sacrifice Hit | 0 |
| 13 | Hits | 9 |
| 3 | Stolen Bases | 1 |
| 2 | Walks | 2 |
| 0 | Catcher Interference | 0 |
| 5 | Runs | 6 |
| 1 | Ground Into Double Play | 0 |
| 0 | Sacrifice Flies | 0 |
| 38 | At Bats | 32 |
| 1 | Home Runs | 3 |
| 0 | Grand Slam Home Runs | 0 |
| 20 | Runners Left On Base | 11 |
| 0 | Triples | 0 |
| 0 | Game Winning RBIs | 1 |
| 0 | Intentional Walks | 0 |
| 0 | Doubles | 2 |
| 17 | Fly Balls | 15 |
| 0 | Caught Stealing | 1 |
| 175 | Pitches | 120 |
| 0 | Games Started | 0 |
| 2 | Pinch At Bats | 0 |
| 0 | Pinch Hits | 0 |
| 0.0 | Player Rating | 0.0 |
| 1 | Is Qualified | 1 |
| 1 | Is Qualified In Steals | 1 |
| 16 | Total Bases | 20 |
| 42 | Plate Appearances | 35 |
| 162.0 | Projected Home Runs | 486.0 |
| 1 | Extra Base Hits | 5 |
| 6.6 | Runs Created | 6.6 |
| .342 | Batting Average | .281 |
| .000 | Pinch Hit Average | .000 |
| .421 | Slugging Percentage | .625 |
| .211 | Secondary Average | .406 |
| .390 | On Base Percentage | .343 |
| .811 | OBP Pct + SLG Pct | .968 |
| 0.6 | Ground To Fly Ball Ratio | 0.7 |
| 6.6 | Runs Created Per 27 Outs | 7.4 |
| 39.0 | Batter Rating | 47.0 |
| 38.0 | At Bats Per Home Run | 10.7 |
| 1.00 | Stolen Base Percentage | 0.50 |
| 4.17 | Pitches Per Plate Appearance | 3.43 |
| .079 | Isolated Power | .344 |
| 0.17 | Walk To Strikeout Ratio | 0.29 |
| .048 | Walks Per Plate Appearance | .057 |
| -.132 | Secondary Average Minus Batting Average | .125 |
| 10.0 | Runs Produced | 12.0 |
| 1.0 | Runs Ratio | 1.0 |
| 0.5 | Patience Ratio | 0.7 |
| 0.5 | Balls In Play Average | 0.3 |
| 90.5 | MLB Rating | 93.3 |
| 0.0 | Offensive Wins Above Replacement | 0.0 |
| 0.0 | Wins Above Replacement | 0.0 |
Game Information
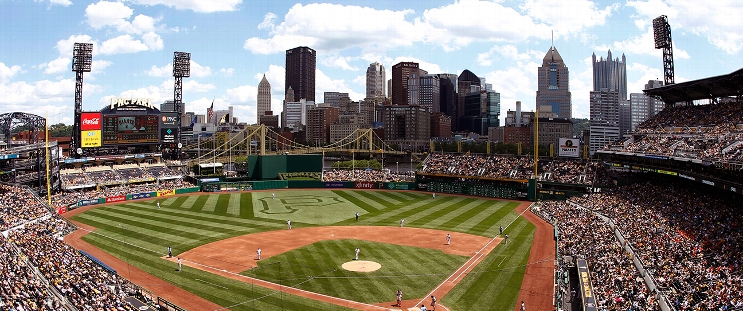
Location: Pittsburgh, Pennsylvania
Attendance: 21,004 | Capacity:
2026 American League Central Standings
| TEAM | W | L | PCT | GB | STRK |
|---|---|---|---|---|---|
 Cleveland |
- | 77 | L1 | 0.52469134 | 85 |
 Chicago |
1 | 78 | W1 | 0.5185185 | 84 |
 Minnesota |
8 | 85 | W1 | 0.47530866 | 77 |
 Detroit |
9 | 86 | L1 | 0.4691358 | 76 |
| Kansas City |
16 | 93 | W1 | 0.42592594 | 69 |
2026 National League Central Standings
| TEAM | W | L | PCT | GB | STRK |
|---|---|---|---|---|---|
 Milwaukee |
- | 59 | W5 | 0.63580245 | 103 |
 Chicago |
14 | 73 | W1 | 0.5493827 | 89 |
| Pittsburgh |
21 | 80 | W1 | 0.50617284 | 82 |
 St. Louis |
26 | 85 | L4 | 0.47530866 | 77 |
 Cincinnati |
28 | 87 | L1 | 0.46296296 | 75 |