
Washington Nationals at St. Louis Cardinals
· Major League Baseball
9 - 1

CJ Abrams joins 30-30 club as Nationals rout Cardinals 9-1

Abrams joined the Cubs' Pete Crow-Armstrong as the only players to hit 30 homers and steal 30 bases this season. He is just the second National to do it, joining Alfonso Soriano in 2006.
Cavalli (13-5) struck out the side in the first, and finished with six strikeouts and four hits in five innings of work.
His 200th strikeout came on his final pitch of the night, and he became the fifth Nationals pitcher with a 200-strikeout season — joining Patrick Corbin, Gio Gonzalez, Max Scherzer, and Stephen Strasburg — just hours after inking a four-year, $47 million contract extension.
The Nats scored three runs in the first, started by Abrams' RBI single. Abrams then stole his 30th base, and an errant throw from Cardinals catcher Leo Bernal let Dylan Crews come around to score. Brady House added an RBI groundout before the end of the frame.
Crews started a four-run third with his 12th homer of the season, a two-run shot to right, and Yohandy Morales added a two-run double.
Daylen Lile hit a sacrifice fly in the fourth and James Wood had an RBI double in the sixth to round out the scoring.
Bernal had two hits for the Cardinals. Kyle Leahy (10-5) allowed a season-high seven runs (six earned) on five hits. He walked three and struck out one.
With the loss, St. Louis was mathematically eliminated from playoff contention.
See AP's full MLB coverage here
How can I watch Washington Nationals vs. St. Louis Cardinals?
- TV Channel: Nationals at Cardinals 2022 MLB Baseball, is broadcasted on MLB.TV.
- Online streaming: Sign up for Fubo.
Scoring Summary
 |
9th Inning | Prieto grounded out to second. |
|
9th Inning | Torres flied out to left. |
|
9th Inning | Saggese flied out to right. |
|
9th Inning | Bernal singled to center. |
 |
9th Inning | Gray relieved Sinclair |
|
9th Inning | Nuñez grounded out to third. |
Statistics
 WSH |
 STL |
|
|---|---|---|
| 1 | Games Played | 1 |
| 1 | Team Games Played | 1 |
| 0 | Hit By Pitch | 1 |
| 16 | Ground Balls | 10 |
| 6 | Strikeouts | 9 |
| 8 | Runs Batted In | 1 |
| 0 | Sacrifice Hit | 0 |
| 7 | Hits | 7 |
| 1 | Stolen Bases | 0 |
| 6 | Walks | 1 |
| 0 | Catcher Interference | 0 |
| 9 | Runs | 1 |
| 1 | Ground Into Double Play | 1 |
| 1 | Sacrifice Flies | 0 |
| 33 | At Bats | 33 |
| 1 | Home Runs | 0 |
| 0 | Grand Slam Home Runs | 0 |
| 10 | Runners Left On Base | 20 |
| 0 | Triples | 0 |
| 1 | Game Winning RBIs | 0 |
| 0 | Intentional Walks | 0 |
| 4 | Doubles | 1 |
| 12 | Fly Balls | 14 |
| 0 | Caught Stealing | 0 |
| 163 | Pitches | 120 |
| 0 | Games Started | 0 |
| 1 | Pinch At Bats | 1 |
| 0 | Pinch Hits | 0 |
| 0.0 | Player Rating | 0.0 |
| 1 | Is Qualified | 1 |
| 1 | Is Qualified In Steals | 0 |
| 14 | Total Bases | 8 |
| 40 | Plate Appearances | 35 |
| 162.0 | Projected Home Runs | 0.0 |
| 5 | Extra Base Hits | 1 |
| 5.0 | Runs Created | 1.6 |
| .212 | Batting Average | .212 |
| .000 | Pinch Hit Average | .000 |
| .424 | Slugging Percentage | .242 |
| .424 | Secondary Average | .061 |
| .325 | On Base Percentage | .257 |
| .749 | OBP Pct + SLG Pct | .500 |
| 1.3 | Ground To Fly Ball Ratio | 0.7 |
| 4.8 | Runs Created Per 27 Outs | 1.6 |
| 53.0 | Batter Rating | 13.0 |
| 33.0 | At Bats Per Home Run | 0.0 |
| 1.00 | Stolen Base Percentage | 0.00 |
| 4.08 | Pitches Per Plate Appearance | 3.43 |
| .212 | Isolated Power | .030 |
| 1.00 | Walk To Strikeout Ratio | 0.11 |
| .150 | Walks Per Plate Appearance | .029 |
| .212 | Secondary Average Minus Batting Average | -.152 |
| 17.0 | Runs Produced | 2.0 |
| 0.9 | Runs Ratio | 1.0 |
| 0.5 | Patience Ratio | 0.3 |
| 0.2 | Balls In Play Average | 0.3 |
| 91.0 | MLB Rating | 67.8 |
| 0.0 | Offensive Wins Above Replacement | 0.0 |
| 0.0 | Wins Above Replacement | 0.0 |
Game Information
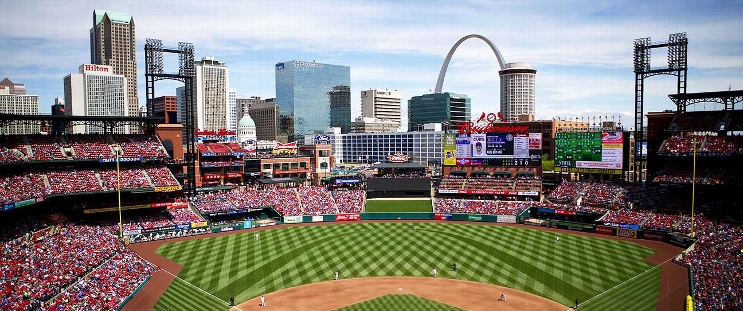
Location: St. Louis, Missouri
Attendance: 25,855 | Capacity:
2026 National League East Standings
| TEAM | W | L | PCT | GB | STRK |
|---|---|---|---|---|---|
 Atlanta |
- | 68 | L1 | 0.5802469 | 94 |
 Philadelphia |
6 | 74 | W1 | 0.54320985 | 88 |
 Miami |
14 | 82 | W1 | 0.49382716 | 80 |
| Washington |
17 | 85 | W1 | 0.47530866 | 77 |
 New York |
20 | 88 | L1 | 0.45679012 | 74 |
2026 National League Central Standings
| TEAM | W | L | PCT | GB | STRK |
|---|---|---|---|---|---|
 Milwaukee |
- | 59 | W5 | 0.63580245 | 103 |
 Chicago |
14 | 73 | W1 | 0.5493827 | 89 |
 Pittsburgh |
21 | 80 | W1 | 0.50617284 | 82 |
| St. Louis |
26 | 85 | L4 | 0.47530866 | 77 |
 Cincinnati |
28 | 87 | L1 | 0.46296296 | 75 |