
Toronto Blue Jays at Texas Rangers
· Major League Baseball
1 - 7

Corey Seager's RBI double helps Rangers beat sloppy Blue Jays 7-1 and close gap in playoff race

The Rangers (77-77) reached .500 for a majors-leading 23rd time and pulled within one game of the White Sox for the third and final AL wild-card spot, although Chicago has the tiebreaker. The defending AL champion Blue Jays (76-78) are two games back in the wild-card race.
Texas also closed the gap on Houston by pulling even with the Astros atop the AL West, but the Rangers would have to win the division outright to finish ahead of their in-state rival. Houston lost to Atlanta 6-2.
The Rangers took the lead in the second on Evan Carter's bases-loaded grounder that scored Wyatt Langford, and Jake Burger also came home when shortstop Ernie Clement's throw trying to force him out at third bounced wide of the bag into foul territory. Seager made it 4-0 with his double.
Dylan Cease (11-6) walked a season-high six among his first 15 batters and was replaced with two outs in the third after throwing 38 balls and 36 strikes.
Five of the Texas runs were unearned as the Blue Jays walked 10 and had three throwing errors, two by third baseman Kazuma Okamoto.
Trevor Williams (2-0) finished with four scoreless innings after starter Kumar Rocker took a 4-0 lead into the fifth but couldn't finish and was replaced by Tyler Alexander.
Toronto's Nathan Lukes had the longest active hitting streak in the majors stopped at 13 games when he was replaced by pinch-hitter Davis Schneider in the fifth. Lukes was 0 for 2 with a deep liner that Carter, the center fielder, ran down at the wall in right center.
This story is updated to correct that the Rangers scored five unearned runs, not six.
See AP’s full MLB coverage here
How can I watch Toronto Blue Jays vs. Texas Rangers?
- TV Channel: Blue Jays at Rangers 2022 MLB Baseball, is broadcasted on MLB.TV.
- Online streaming: Sign up for Fubo.
Scoring Summary
 |
9th Inning | Smith lined out to right. |
|
9th Inning | Okamoto flied out to left. |
|
9th Inning | Kirk grounded out to shortstop. |
 |
9th Inning | Osuna in right field. |
|
8th Inning | Lopez struck out swinging. |
|
8th Inning | Burger doubled to right, Langford scored. |
Statistics
 TOR |
 TEX |
|
|---|---|---|
| 1 | Games Played | 1 |
| 1 | Team Games Played | 1 |
| 0 | Hit By Pitch | 0 |
| 14 | Ground Balls | 10 |
| 7 | Strikeouts | 9 |
| 1 | Runs Batted In | 6 |
| 0 | Sacrifice Hit | 0 |
| 5 | Hits | 7 |
| 0 | Stolen Bases | 2 |
| 2 | Walks | 10 |
| 0 | Catcher Interference | 0 |
| 1 | Runs | 7 |
| 0 | Ground Into Double Play | 1 |
| 0 | Sacrifice Flies | 2 |
| 32 | At Bats | 31 |
| 0 | Home Runs | 0 |
| 0 | Grand Slam Home Runs | 0 |
| 14 | Runners Left On Base | 25 |
| 0 | Triples | 0 |
| 0 | Game Winning RBIs | 1 |
| 0 | Intentional Walks | 0 |
| 1 | Doubles | 3 |
| 11 | Fly Balls | 14 |
| 0 | Caught Stealing | 0 |
| 135 | Pitches | 180 |
| 0 | Games Started | 0 |
| 2 | Pinch At Bats | 0 |
| 0 | Pinch Hits | 0 |
| 0.0 | Player Rating | 0.0 |
| 1 | Is Qualified | 1 |
| 0 | Is Qualified In Steals | 1 |
| 6 | Total Bases | 10 |
| 34 | Plate Appearances | 43 |
| 0.0 | Projected Home Runs | 0.0 |
| 1 | Extra Base Hits | 3 |
| 0.8 | Runs Created | 5.6 |
| .156 | Batting Average | .226 |
| .000 | Pinch Hit Average | .000 |
| .188 | Slugging Percentage | .323 |
| .094 | Secondary Average | .484 |
| .206 | On Base Percentage | .395 |
| .393 | OBP Pct + SLG Pct | .718 |
| 1.3 | Ground To Fly Ball Ratio | 0.7 |
| 0.8 | Runs Created Per 27 Outs | 5.6 |
| 11.0 | Batter Rating | 41.0 |
| 0.0 | At Bats Per Home Run | 0.0 |
| 0.00 | Stolen Base Percentage | 1.00 |
| 3.97 | Pitches Per Plate Appearance | 4.19 |
| .031 | Isolated Power | .097 |
| 0.29 | Walk To Strikeout Ratio | 1.11 |
| .059 | Walks Per Plate Appearance | .233 |
| -.063 | Secondary Average Minus Batting Average | .258 |
| 2.0 | Runs Produced | 13.0 |
| 1.0 | Runs Ratio | 0.9 |
| 0.2 | Patience Ratio | 0.5 |
| 0.2 | Balls In Play Average | 0.3 |
| 64.0 | MLB Rating | 84.3 |
| 0.0 | Offensive Wins Above Replacement | 0.0 |
| 0.0 | Wins Above Replacement | 0.0 |
Game Information
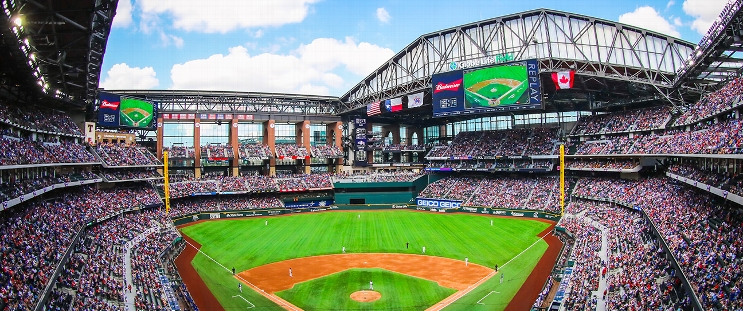
Location: Arlington, Texas
Attendance: 31,045 | Capacity:
2026 American League East Standings
| TEAM | W | L | PCT | GB | STRK |
|---|---|---|---|---|---|
 Tampa Bay |
- | 64 | L1 | 0.60493827 | 98 |
 New York |
4.5 | 68 | W1 | 0.57763976 | 93 |
 Boston |
11 | 75 | L1 | 0.537037 | 87 |
 Baltimore |
18.5 | 82 | L1 | 0.49068323 | 79 |
| Toronto |
19 | 83 | W1 | 0.48765433 | 79 |
2026 American League West Standings
| TEAM | W | L | PCT | GB | STRK |
|---|---|---|---|---|---|
 Houston |
- | 81 | W2 | 0.5 | 81 |
| Texas |
1 | 82 | L1 | 0.49382716 | 80 |
 Seattle |
5 | 86 | W2 | 0.4691358 | 76 |
 Athletics |
17 | 98 | L2 | 0.39506173 | 64 |
 Los Angeles |
19 | 100 | L2 | 0.38271606 | 62 |