
Milwaukee Brewers at Baltimore Orioles
· Major League Baseball
6 - 5

Chourio's homer and Frelick's RBI single in 10th carry Brewers past Orioles 6-5

Although the Brewers own the best record in the majors (96-58) and have already clinched their fourth straight NL Central title, they aren't coasting to the finish. Milwaukee is still looking to wrap up a first-round bye in the playoffs and earn home-field advantage throughout the postseason.
“We're trying to win games and keep everybody healthy,” manager Pat Murphy said before the game.
The Brewers got their eighth victory in 10 games despite blowing a two-run lead in the ninth. After William Contreras hit a tiebreaking double and Christian Yelich tacked on a run-scoring single in the top half, Baltimore pulled even in the bottom half against Trevor Megill (3-3) with two hits and a pair of sacrifice flies.
In the 10th, automatic runner Joey Ortiz advanced on a bunt and trotted home when Frelick bounced a single to right field off Grant Wolfram (6-4).
Chad Patrick got three outs for his sixth save.
Like Milwaukee, the Orioles (75-79) are also in a playoff race. But Baltimore is running out of time in its bid to claim the final AL wild-card spot.
Chourio put Milwaukee up 3-0 in the second inning with a shot to center off Cade Povich. Pete Alonso answered in the third with his 38th homer following an infield single and a walk.
Alonso has homered in three straight games, beginning with a ninth-inning, game-tying drive Tuesday night against his former team, the New York Mets.
Brewers starter Dustin May gave up three runs and six hits before being yanked with one out in the third. In eight starts since coming to Milwaukee in an Aug. 3 trade with St. Louis, the right-hander is 2-2 with a 5.40 ERA.
See AP’s full MLB coverage here
How can I watch Milwaukee Brewers vs. Baltimore Orioles?
- TV Channel: Brewers at Orioles 2022 MLB Baseball, is broadcasted on MLB.TV.
- Online streaming: Sign up for Fubo.
Scoring Summary
 |
10th Inning | Beavers flied out to shortstop. |
|
10th Inning | Taveras flied out to left. |
|
10th Inning | Jackson struck out looking. |
 |
10th Inning | Patrick relieved Megill |
|
10th Inning | Hamilton at third base. |
|
10th Inning | Ortiz at shortstop. |
Statistics
 MIL |
 BAL |
|
|---|---|---|
| 1 | Games Played | 1 |
| 1 | Team Games Played | 1 |
| 0 | Hit By Pitch | 1 |
| 14 | Ground Balls | 11 |
| 10 | Strikeouts | 13 |
| 6 | Runs Batted In | 5 |
| 1 | Sacrifice Hit | 0 |
| 10 | Hits | 12 |
| 4 | Stolen Bases | 0 |
| 6 | Walks | 3 |
| 0 | Catcher Interference | 0 |
| 6 | Runs | 5 |
| 0 | Ground Into Double Play | 0 |
| 0 | Sacrifice Flies | 2 |
| 39 | At Bats | 40 |
| 1 | Home Runs | 1 |
| 0 | Grand Slam Home Runs | 0 |
| 21 | Runners Left On Base | 23 |
| 0 | Triples | 0 |
| 1 | Game Winning RBIs | 0 |
| 0 | Intentional Walks | 0 |
| 1 | Doubles | 3 |
| 16 | Fly Balls | 18 |
| 0 | Caught Stealing | 0 |
| 183 | Pitches | 194 |
| 0 | Games Started | 0 |
| 2 | Pinch At Bats | 2 |
| 0 | Pinch Hits | 0 |
| 0.0 | Player Rating | 0.0 |
| 1 | Is Qualified | 1 |
| 1 | Is Qualified In Steals | 0 |
| 14 | Total Bases | 18 |
| 46 | Plate Appearances | 46 |
| 162.0 | Projected Home Runs | 162.0 |
| 2 | Extra Base Hits | 4 |
| 6.3 | Runs Created | 6.8 |
| .256 | Batting Average | .300 |
| .000 | Pinch Hit Average | .000 |
| .359 | Slugging Percentage | .450 |
| .359 | Secondary Average | .225 |
| .356 | On Base Percentage | .348 |
| .715 | OBP Pct + SLG Pct | .798 |
| 0.9 | Ground To Fly Ball Ratio | 0.6 |
| 5.7 | Runs Created Per 27 Outs | 6.1 |
| 43.0 | Batter Rating | 41.0 |
| 39.0 | At Bats Per Home Run | 40.0 |
| 1.00 | Stolen Base Percentage | 0.00 |
| 3.98 | Pitches Per Plate Appearance | 4.22 |
| .103 | Isolated Power | .150 |
| 0.60 | Walk To Strikeout Ratio | 0.23 |
| .130 | Walks Per Plate Appearance | .065 |
| .103 | Secondary Average Minus Batting Average | -.075 |
| 12.0 | Runs Produced | 10.0 |
| 1.0 | Runs Ratio | 1.0 |
| 0.5 | Patience Ratio | 0.5 |
| 0.3 | Balls In Play Average | 0.4 |
| 88.0 | MLB Rating | 90.3 |
| 0.0 | Offensive Wins Above Replacement | 0.0 |
| 0.0 | Wins Above Replacement | 0.0 |
Game Information
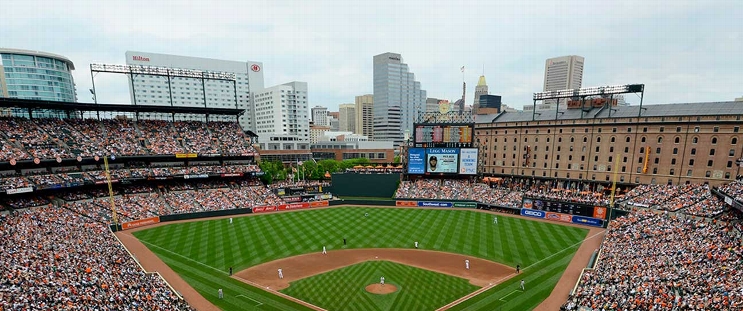
Location: Baltimore, Maryland
Attendance: 25,304 | Capacity:
2026 National League Central Standings
| TEAM | W | L | PCT | GB | STRK |
|---|---|---|---|---|---|
| Milwaukee |
- | 59 | W5 | 0.63580245 | 103 |
 Chicago |
14 | 73 | W1 | 0.5493827 | 89 |
 Pittsburgh |
21 | 80 | W1 | 0.50617284 | 82 |
 St. Louis |
26 | 85 | L4 | 0.47530866 | 77 |
 Cincinnati |
28 | 87 | L1 | 0.46296296 | 75 |
2026 American League East Standings
| TEAM | W | L | PCT | GB | STRK |
|---|---|---|---|---|---|
 Tampa Bay |
- | 64 | L1 | 0.60493827 | 98 |
 New York |
4.5 | 68 | W1 | 0.57763976 | 93 |
 Boston |
11 | 75 | L1 | 0.537037 | 87 |
| Baltimore |
18.5 | 82 | L1 | 0.49068323 | 79 |
 Toronto |
19 | 83 | W1 | 0.48765433 | 79 |