
Boston Red Sox at Texas Rangers
· Major League Baseball
4 - 3

Trevor Story's 3-run homer lifts Red Sox to 4-3 win, dropping Rangers into 2nd place in AL West

Texas (76-77) had won four straight games to gain a share of the lead but dropped one game behind Houston (77-76), which holds the tiebreaker. The Rangers trail by two games for the last AL wild card.
Boston (83-70) has a five-game lead for the top AL wild card and improved to 8-59 when trailing after seven innings. Texas dropped to 63-2 when leading after seven innings.
Latz (3-3) entered after Wilyer Abreu walked starting the eighth and Willson Contreras was hit by a pitch from Jakob Junis.
Latz struck out Adley Rutschman and Story, who is from nearby Irving, reached down for Latz's second straight low curveball and drove the ball over the left-field wall for his fourth home run this season.
Boston’s Wyatt Olds (2-0) got three outs and Garrett Whitlock pitched the ninth for his fourth save in eight chances, getting Jake Burger to ground into a game-ending double play.
Josh Jung hit a first-inning homer off Sonny Gray, and Texas opened a 3-0 lead in the second on Danny Jansen's RBI single and Evan Carter's safety squeeze bunt.
Roman Anthony hit into a run-scoring forceout in the seventh.
Texas’ Cody Bradford followed a one-inning opener with 4 1/3 shutout innings, seeking his first major league since Sept. 18, 2024. He missed last season following elbow surgery.
Gray gave up three hits in 6 1/3 innings, throwing a season-high 102 pitches.
Rangers: RHP Kumar Rocker (5-11, 4.54) starts Friday against visiting Toronto and RHP Dylan Cease (11-5, 2.38).
See AP’s full MLB coverage here
How can I watch Boston Red Sox vs. Texas Rangers?
- TV Channel: Red Sox at Rangers 2022 MLB Baseball, is broadcasted on MLB.TV.
- Online streaming: Sign up for Fubo.
Scoring Summary
 |
9th Inning | Burger grounded into double play, shortstop to second to first, Langford out at second. |
|
9th Inning | Langford walked. |
|
9th Inning | Nimmo grounded out to first. |
 |
9th Inning | Whitlock relieved Gamboa |
|
9th Inning | Gasper popped out to first. |
|
9th Inning | Anthony grounded out to second. |
Statistics
 BOS |
 TEX |
|
|---|---|---|
| 1 | Games Played | 1 |
| 1 | Team Games Played | 1 |
| 1 | Hit By Pitch | 0 |
| 10 | Ground Balls | 10 |
| 6 | Strikeouts | 7 |
| 4 | Runs Batted In | 3 |
| 0 | Sacrifice Hit | 2 |
| 5 | Hits | 4 |
| 0 | Stolen Bases | 0 |
| 5 | Walks | 4 |
| 0 | Catcher Interference | 0 |
| 4 | Runs | 3 |
| 0 | Ground Into Double Play | 2 |
| 0 | Sacrifice Flies | 0 |
| 32 | At Bats | 27 |
| 1 | Home Runs | 1 |
| 0 | Grand Slam Home Runs | 0 |
| 15 | Runners Left On Base | 8 |
| 0 | Triples | 0 |
| 1 | Game Winning RBIs | 0 |
| 0 | Intentional Walks | 0 |
| 1 | Doubles | 0 |
| 16 | Fly Balls | 12 |
| 0 | Caught Stealing | 0 |
| 167 | Pitches | 133 |
| 0 | Games Started | 0 |
| 1 | Pinch At Bats | 0 |
| 0 | Pinch Hits | 0 |
| 0.0 | Player Rating | 0.0 |
| 1 | Is Qualified | 1 |
| 0 | Is Qualified In Steals | 0 |
| 9 | Total Bases | 7 |
| 38 | Plate Appearances | 33 |
| 162.0 | Projected Home Runs | 162.0 |
| 2 | Extra Base Hits | 1 |
| 3.0 | Runs Created | 1.3 |
| .156 | Batting Average | .148 |
| .000 | Pinch Hit Average | .000 |
| .281 | Slugging Percentage | .259 |
| .281 | Secondary Average | .259 |
| .289 | On Base Percentage | .258 |
| .571 | OBP Pct + SLG Pct | .517 |
| 0.6 | Ground To Fly Ball Ratio | 0.8 |
| 3.0 | Runs Created Per 27 Outs | 1.3 |
| 26.0 | Batter Rating | 19.0 |
| 32.0 | At Bats Per Home Run | 27.0 |
| 0.00 | Stolen Base Percentage | 0.00 |
| 4.39 | Pitches Per Plate Appearance | 4.03 |
| .125 | Isolated Power | .111 |
| 0.83 | Walk To Strikeout Ratio | 0.57 |
| .132 | Walks Per Plate Appearance | .121 |
| .125 | Secondary Average Minus Batting Average | .111 |
| 8.0 | Runs Produced | 6.0 |
| 1.0 | Runs Ratio | 1.0 |
| 0.4 | Patience Ratio | 0.4 |
| 0.2 | Balls In Play Average | 0.2 |
| 74.3 | MLB Rating | 70.0 |
| 0.0 | Offensive Wins Above Replacement | 0.0 |
| 0.0 | Wins Above Replacement | 0.0 |
Game Information
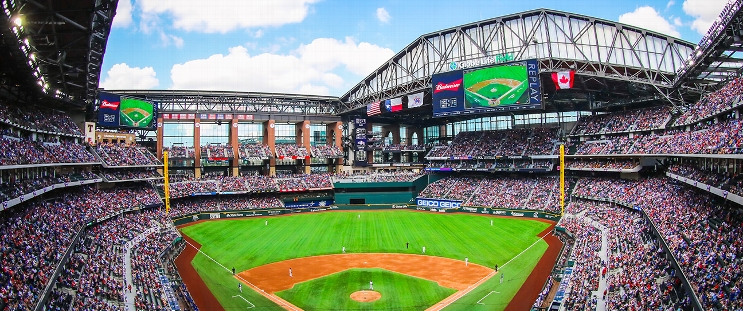
Location: Arlington, Texas
Attendance: 30,828 | Capacity:
2026 American League East Standings
| TEAM | W | L | PCT | GB | STRK |
|---|---|---|---|---|---|
 Tampa Bay |
- | 64 | L1 | 0.60493827 | 98 |
 New York |
4.5 | 68 | W1 | 0.57763976 | 93 |
| Boston |
11 | 75 | L1 | 0.537037 | 87 |
 Baltimore |
18.5 | 82 | L1 | 0.49068323 | 79 |
 Toronto |
19 | 83 | W1 | 0.48765433 | 79 |
2026 American League West Standings
| TEAM | W | L | PCT | GB | STRK |
|---|---|---|---|---|---|
 Houston |
- | 81 | W2 | 0.5 | 81 |
| Texas |
1 | 82 | L1 | 0.49382716 | 80 |
 Seattle |
5 | 86 | W2 | 0.4691358 | 76 |
 Athletics |
17 | 98 | L2 | 0.39506173 | 64 |
 Los Angeles |
19 | 100 | L2 | 0.38271606 | 62 |