
Arizona Diamondbacks at Kansas City Royals
· Major League Baseball
2 - 5

Witt homers to help the Royals beat the Diamondbacks 5-2

The Diamondbacks' winning streak ended at four and they fell a half-game behind San Diego for the third wild card in the National League.
It was the third straight series in which the Royals won the final game to avoid a sweep.
Daniel Lynch (5-5) picked up the win, his first since moving into the starting rotation in early August. He allowed two runs on four hits in five innings. Nate Pearson earned his fourth save.
Michael Soroka (8-5) took the loss in relief, allowing three runs in four innings.
The Royals got an unearned run in the second inning. John Rave and Kyle Isbel recorded two-out singles. Rave stole third base and catcher James McCann's throw went into left, allowing Rave to score. It marked the first time in the series that the Diamondbacks trailed.
The Royals added a run in the third on Carter Jensen's 23rd home run. Each of Jensen's last nine hits have gone for extra bases. He sits in second place in Royals history for home runs by a rookie (Bob Hamelin, 24, 1994).
The Diamondbacks answered quickly on Nolan Arenado's 430-foot solo home run leading off the fourth. The Diamondbacks then tied it in the fourth on a two-out RBI single by Ketel Marte.
Witt put the Royals back in the lead with his homer in the bottom of the fifth.
How can I watch Arizona Diamondbacks vs. Kansas City Royals?
- TV Channel: Diamondbacks at Royals 2022 MLB Baseball, is broadcasted on MLB.TV.
- Online streaming: Sign up for Fubo.
Scoring Summary
 |
9th Inning | Marte grounded into double play, second to shortstop to first, Nootbaar out at second. |
|
9th Inning | Moreno struck out swinging. |
|
9th Inning | Moreno hit for Vargas |
|
9th Inning | Nootbaar walked, Lawlar to second. |
|
9th Inning | Lawlar singled to center. |
 |
9th Inning | Pearson relieved Kimbrel |
Statistics
 ARI |
 KC |
|
|---|---|---|
| 1 | Games Played | 1 |
| 1 | Team Games Played | 1 |
| 0 | Hit By Pitch | 0 |
| 13 | Ground Balls | 7 |
| 6 | Strikeouts | 5 |
| 2 | Runs Batted In | 4 |
| 1 | Sacrifice Hit | 0 |
| 9 | Hits | 7 |
| 0 | Stolen Bases | 1 |
| 4 | Walks | 3 |
| 0 | Catcher Interference | 0 |
| 2 | Runs | 5 |
| 2 | Ground Into Double Play | 1 |
| 0 | Sacrifice Flies | 0 |
| 33 | At Bats | 29 |
| 1 | Home Runs | 2 |
| 0 | Grand Slam Home Runs | 0 |
| 23 | Runners Left On Base | 7 |
| 0 | Triples | 0 |
| 0 | Game Winning RBIs | 1 |
| 0 | Intentional Walks | 0 |
| 1 | Doubles | 0 |
| 15 | Fly Balls | 17 |
| 0 | Caught Stealing | 1 |
| 146 | Pitches | 137 |
| 0 | Games Started | 0 |
| 2 | Pinch At Bats | 0 |
| 0 | Pinch Hits | 0 |
| 0.0 | Player Rating | 0.0 |
| 1 | Is Qualified | 1 |
| 0 | Is Qualified In Steals | 1 |
| 13 | Total Bases | 13 |
| 38 | Plate Appearances | 32 |
| 162.0 | Projected Home Runs | 324.0 |
| 2 | Extra Base Hits | 2 |
| 4.2 | Runs Created | 3.7 |
| .273 | Batting Average | .241 |
| .000 | Pinch Hit Average | .000 |
| .394 | Slugging Percentage | .448 |
| .242 | Secondary Average | .310 |
| .351 | On Base Percentage | .313 |
| .745 | OBP Pct + SLG Pct | .761 |
| 0.9 | Ground To Fly Ball Ratio | 0.4 |
| 4.2 | Runs Created Per 27 Outs | 4.1 |
| 22.0 | Batter Rating | 32.0 |
| 33.0 | At Bats Per Home Run | 14.5 |
| 0.00 | Stolen Base Percentage | 0.50 |
| 3.84 | Pitches Per Plate Appearance | 4.28 |
| .121 | Isolated Power | .207 |
| 0.67 | Walk To Strikeout Ratio | 0.60 |
| .105 | Walks Per Plate Appearance | .094 |
| -.030 | Secondary Average Minus Batting Average | .069 |
| 4.0 | Runs Produced | 9.0 |
| 1.0 | Runs Ratio | 0.8 |
| 0.5 | Patience Ratio | 0.5 |
| 0.3 | Balls In Play Average | 0.2 |
| 78.8 | MLB Rating | 82.0 |
| 0.0 | Offensive Wins Above Replacement | 0.0 |
| 0.0 | Wins Above Replacement | 0.0 |
Game Information
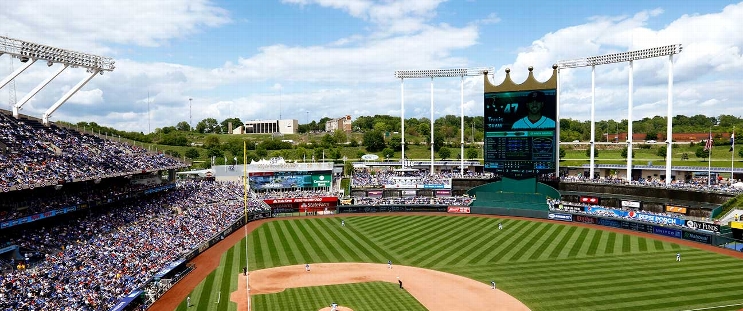
Location: Kansas City, Missouri
Attendance: 15,369 | Capacity:
2026 National League West Standings
| TEAM | W | L | PCT | GB | STRK |
|---|---|---|---|---|---|
 Los Angeles |
- | 62 | W3 | 0.61728394 | 100 |
 San Diego |
9 | 71 | W2 | 0.5617284 | 91 |
| Arizona |
14 | 76 | L2 | 0.5308642 | 86 |
 San Francisco |
35 | 97 | L5 | 0.40123457 | 65 |
 Colorado |
42 | 104 | L1 | 0.3580247 | 58 |
2026 American League Central Standings
| TEAM | W | L | PCT | GB | STRK |
|---|---|---|---|---|---|
 Cleveland |
- | 77 | L1 | 0.52469134 | 85 |
 Chicago |
1 | 78 | W1 | 0.5185185 | 84 |
 Minnesota |
8 | 85 | W1 | 0.47530866 | 77 |
 Detroit |
9 | 86 | L1 | 0.4691358 | 76 |
| Kansas City |
16 | 93 | W1 | 0.42592594 | 69 |