
San Francisco Giants at Pittsburgh Pirates
· Major League Baseball
5 - 4

Rafael Devers hits 32nd homer, extends hit streak to 10 games as Giants beat Pirates 5-4 in 10

Devers had a solo shot with one out in the first inning to open the scoring a night after the Giants dropped a wild 13-12 decision in the series opener. The first baseman extended his hitting streak to 10 games by going 2 for 3 with two walks.
Bryce Eldridge’s RBI double down the left-field line in the 10th inning put the Giants ahead 4-3 and Turner Hill added a sacrifice fly. Both runs came off Camilo Doval (3-2), who led the NL with 39 saves for the Giants in 2023.
The Pirates had runners on first and second with two outs in the ninth. However, Hill made a sliding catch of Nick Gonzales’ sinking liner to left field to preserve the 3-3 tie.
The Pirates scored single runs in the seventh and eighth innings.
Jason Foley (2-1) pitched a scoreless ninth. Dylan Smith allowed the automatic runner to score in the 10th but closed it out for his fourth save.
The Giants scored twice off rookie Bubba Chandler in the fifth to break a 1-1 tie. Eldridge hit a sacrifice fly, and Hill had an RBI single.
Pirates rookie Esmerlyn Valdez drew a bases-loaded walk from Brandon Roupp with two outs in the fourth. Roupp allowed only one run and two hits in five innings. Chandler also pitched five innings and gave up three runs and five hits.
See AP’s full MLB coverage here
How can I watch San Francisco Giants vs. Pittsburgh Pirates?
- TV Channel: Giants at Pirates 2022 MLB Baseball, is broadcasted on MLB.TV.
- Online streaming: Sign up for Fubo.
Scoring Summary
 |
10th Inning | Flores Jr. lined out to center. |
|
10th Inning | Valdez struck out looking. |
|
10th Inning | Cruz struck out swinging. |
|
10th Inning | Gonzales singled to center, Reynolds scored. |
 |
10th Inning | Smith relieved Foley |
|
10th Inning | McCray as designated hitter. |
Statistics
 SF |
 PIT |
|
|---|---|---|
| 1 | Games Played | 1 |
| 1 | Team Games Played | 1 |
| 0 | Hit By Pitch | 0 |
| 14 | Ground Balls | 16 |
| 6 | Strikeouts | 8 |
| 5 | Runs Batted In | 4 |
| 2 | Sacrifice Hit | 1 |
| 7 | Hits | 8 |
| 0 | Stolen Bases | 1 |
| 4 | Walks | 5 |
| 0 | Catcher Interference | 0 |
| 5 | Runs | 4 |
| 0 | Ground Into Double Play | 0 |
| 2 | Sacrifice Flies | 0 |
| 33 | At Bats | 37 |
| 1 | Home Runs | 0 |
| 0 | Grand Slam Home Runs | 0 |
| 10 | Runners Left On Base | 22 |
| 0 | Triples | 0 |
| 1 | Game Winning RBIs | 0 |
| 1 | Intentional Walks | 1 |
| 2 | Doubles | 3 |
| 17 | Fly Balls | 14 |
| 0 | Caught Stealing | 0 |
| 148 | Pitches | 157 |
| 0 | Games Started | 0 |
| 1 | Pinch At Bats | 1 |
| 0 | Pinch Hits | 1 |
| 0.0 | Player Rating | 0.0 |
| 1 | Is Qualified | 1 |
| 0 | Is Qualified In Steals | 1 |
| 12 | Total Bases | 11 |
| 41 | Plate Appearances | 43 |
| 162.0 | Projected Home Runs | 0.0 |
| 3 | Extra Base Hits | 3 |
| 4.0 | Runs Created | 4.0 |
| .212 | Batting Average | .216 |
| .000 | Pinch Hit Average | 1.000 |
| .364 | Slugging Percentage | .297 |
| .273 | Secondary Average | .243 |
| .282 | On Base Percentage | .310 |
| .646 | OBP Pct + SLG Pct | .607 |
| 0.8 | Ground To Fly Ball Ratio | 1.1 |
| 3.6 | Runs Created Per 27 Outs | 3.6 |
| 34.0 | Batter Rating | 31.0 |
| 33.0 | At Bats Per Home Run | 0.0 |
| 0.00 | Stolen Base Percentage | 1.00 |
| 3.61 | Pitches Per Plate Appearance | 3.65 |
| .152 | Isolated Power | .081 |
| 0.67 | Walk To Strikeout Ratio | 0.63 |
| .098 | Walks Per Plate Appearance | .116 |
| .061 | Secondary Average Minus Batting Average | .027 |
| 10.0 | Runs Produced | 8.0 |
| 1.0 | Runs Ratio | 1.0 |
| 0.4 | Patience Ratio | 0.4 |
| 0.2 | Balls In Play Average | 0.3 |
| 82.0 | MLB Rating | 78.5 |
| 0.0 | Offensive Wins Above Replacement | 0.0 |
| 0.0 | Wins Above Replacement | 0.0 |
Game Information
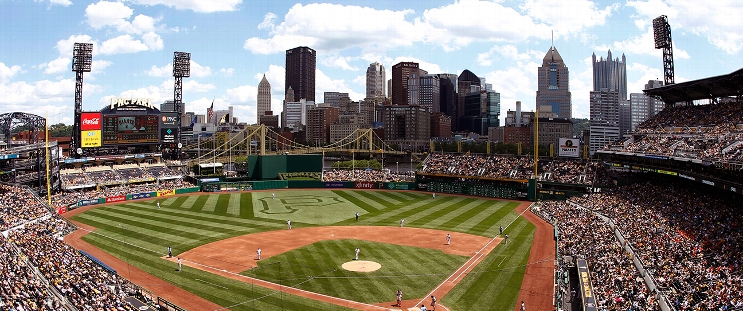
Location: Pittsburgh, Pennsylvania
Attendance: 11,763 | Capacity:
2026 National League West Standings
| TEAM | W | L | PCT | GB | STRK |
|---|---|---|---|---|---|
 Los Angeles |
- | 62 | W3 | 0.61728394 | 100 |
 San Diego |
9 | 71 | W2 | 0.5617284 | 91 |
 Arizona |
14 | 76 | L2 | 0.5308642 | 86 |
| San Francisco |
35 | 97 | L5 | 0.40123457 | 65 |
 Colorado |
42 | 104 | L1 | 0.3580247 | 58 |
2026 National League Central Standings
| TEAM | W | L | PCT | GB | STRK |
|---|---|---|---|---|---|
 Milwaukee |
- | 59 | W5 | 0.63580245 | 103 |
 Chicago |
14 | 73 | W1 | 0.5493827 | 89 |
| Pittsburgh |
21 | 80 | W1 | 0.50617284 | 82 |
 St. Louis |
26 | 85 | L4 | 0.47530866 | 77 |
 Cincinnati |
28 | 87 | L1 | 0.46296296 | 75 |