
Seattle Mariners at Boston Red Sox
· Major League Baseball
8 - 3

Jhonny Pereda has 2 RBIs, Mariners roll past Red Sox 8-3

Julio Rodríguez, Josh Naylor, Dominic Canzone and Randy Arozarena added RBI for Seattle. The Mariners racked up 25 runs and 37 hits over the three-game series, winning the final two as they try to keep their long-shot AL wild-card hopes alive.
Roman Anthony hit his first home run since his return from a 101-game absence with a sprained right wrist for Boston, which has lost four of five as it clings to the league’s second wild-card spot.
Cooper Criswell (3-2) pitched a scoreless ninth inning to get the win. Seattle starter Bryce Miller lasted 4 2/3 innings, allowing one run off seven hits and striking out three.
Boston’s Patrick Sandoval (1-4) lasted four innings, plus one batter, yielding three runs off five hits.
The Mariners jumped in front 4-0 in the third inning. A wild pitch by Sandoval provided the first run. With two outs, Seattle added to it, getting RBI singles by Julio Rodríguez and Josh Naylor.
Jarren Duran’s relay throw on Naylor’s RBI sailed over third baseman Caleb Durbin’s head, allowing Rodríguez to score.
Red Sox: LHP Ranger Suarez (9-6 3.27) gets the nod for the start of Boston’s four-game series Thursday night at Baltimore.
See AP’s full MLB coverage here
How can I watch Seattle Mariners vs. Boston Red Sox?
- TV Channel: Mariners at Red Sox 2022 MLB Baseball, is broadcasted on MLB.TV.
- Online streaming: Sign up for Fubo.
Scoring Summary
 |
9th Inning | Gasper struck out swinging. |
|
9th Inning | Anthony grounded out to third. |
|
9th Inning | Wong grounded out to shortstop. |
 |
9th Inning | Criswell relieved Domínguez |
|
9th Inning | We. Wilson struck out looking. |
|
9th Inning | Young grounded out to first. |
Statistics
 SEA |
 BOS |
|
|---|---|---|
| 1 | Games Played | 1 |
| 1 | Team Games Played | 1 |
| 1 | Hit By Pitch | 0 |
| 20 | Ground Balls | 13 |
| 5 | Strikeouts | 5 |
| 6 | Runs Batted In | 3 |
| 0 | Sacrifice Hit | 0 |
| 12 | Hits | 12 |
| 1 | Stolen Bases | 0 |
| 5 | Walks | 1 |
| 0 | Catcher Interference | 0 |
| 8 | Runs | 3 |
| 2 | Ground Into Double Play | 1 |
| 0 | Sacrifice Flies | 0 |
| 37 | At Bats | 37 |
| 0 | Home Runs | 1 |
| 0 | Grand Slam Home Runs | 0 |
| 18 | Runners Left On Base | 16 |
| 0 | Triples | 0 |
| 0 | Game Winning RBIs | 0 |
| 0 | Intentional Walks | 0 |
| 1 | Doubles | 5 |
| 12 | Fly Balls | 19 |
| 0 | Caught Stealing | 0 |
| 168 | Pitches | 125 |
| 0 | Games Started | 0 |
| 0 | Pinch At Bats | 0 |
| 0 | Pinch Hits | 0 |
| 0.0 | Player Rating | 0.0 |
| 1 | Is Qualified | 1 |
| 1 | Is Qualified In Steals | 0 |
| 13 | Total Bases | 20 |
| 43 | Plate Appearances | 38 |
| 0.0 | Projected Home Runs | 162.0 |
| 1 | Extra Base Hits | 6 |
| 5.7 | Runs Created | 6.3 |
| .324 | Batting Average | .324 |
| .000 | Pinch Hit Average | .000 |
| .351 | Slugging Percentage | .541 |
| .189 | Secondary Average | .243 |
| .419 | On Base Percentage | .342 |
| .770 | OBP Pct + SLG Pct | .883 |
| 1.7 | Ground To Fly Ball Ratio | 0.7 |
| 5.7 | Runs Created Per 27 Outs | 6.5 |
| 43.0 | Batter Rating | 37.0 |
| 0.0 | At Bats Per Home Run | 37.0 |
| 1.00 | Stolen Base Percentage | 0.00 |
| 3.91 | Pitches Per Plate Appearance | 3.29 |
| .027 | Isolated Power | .216 |
| 1.00 | Walk To Strikeout Ratio | 0.20 |
| .116 | Walks Per Plate Appearance | .026 |
| -.135 | Secondary Average Minus Batting Average | -.081 |
| 14.0 | Runs Produced | 6.0 |
| 0.8 | Runs Ratio | 1.0 |
| 0.4 | Patience Ratio | 0.6 |
| 0.4 | Balls In Play Average | 0.4 |
| 92.3 | MLB Rating | 89.8 |
| 0.0 | Offensive Wins Above Replacement | 0.0 |
| 0.0 | Wins Above Replacement | 0.0 |
Game Information
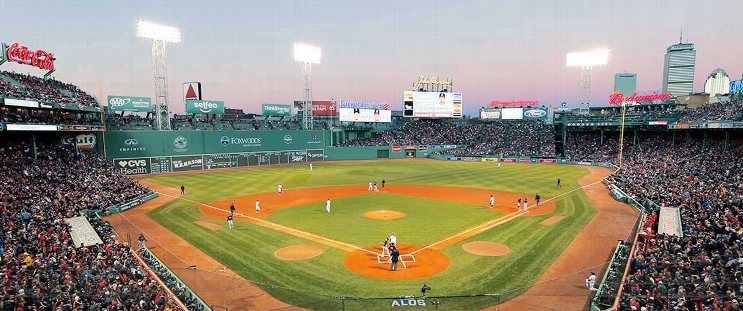
Location: Boston, Massachusetts
Attendance: 33,922 | Capacity:
2026 American League West Standings
| TEAM | W | L | PCT | GB | STRK |
|---|---|---|---|---|---|
 Houston |
- | 81 | W2 | 0.5 | 81 |
 Texas |
1 | 82 | L1 | 0.49382716 | 80 |
| Seattle |
5 | 86 | W2 | 0.4691358 | 76 |
 Athletics |
17 | 98 | L2 | 0.39506173 | 64 |
 Los Angeles |
19 | 100 | L2 | 0.38271606 | 62 |
2026 American League East Standings
| TEAM | W | L | PCT | GB | STRK |
|---|---|---|---|---|---|
 Tampa Bay |
- | 64 | L1 | 0.60493827 | 98 |
 New York |
4.5 | 68 | W1 | 0.57763976 | 93 |
| Boston |
11 | 75 | L1 | 0.537037 | 87 |
 Baltimore |
18.5 | 82 | L1 | 0.49068323 | 79 |
 Toronto |
19 | 83 | W1 | 0.48765433 | 79 |