
San Diego Padres at Tampa Bay Rays
· Major League Baseball
6 - 7

Simpson's RBI single caps 4-run 7th inning as Rays rally to defeat Padres 7-6

Junior Caminero and Jonathan Aranda homered as the Rays won their third straight and for the fifth time in six games.
Kevin Kelly (6-3) earned the win with 1 2/3 innings in relief. Bryan Baker recorded his league-leading 39th save by working a scoreless ninth. Starter Nick Martinez allowed three runs on seven hits and struck out four in six innings.
Bradgley Rodriguez (3-3) took the loss after failing to record an out while facing four batters in the seventh. Walker Buehler allowed seven hits and three runs while striking out three in five innings. Ty France hit a two-run home run for San Diego.
The Rays scored four times in the seventh inning. Diaz hit a bases-loaded single off the base of the wall in center. On the play, Rengifo was injured after taking a relay throw and while trying to cut down Cedric Mullins at the plate in a run down. When his throw sailed wide, Rengifo fell to the ground and two additional runners scored, tying the game at 6.
Rengifo needed assistance to stand and was carted off the field. The Padres said after the game that Rengifo would return to San Diego for further evaluation.
Simpson then delivered a two-out, run-scoring single to left that plated Diaz four batters later.
The Padres took a three-run lead in the top of the seventh on Manny Machado's two-run single with the bases loaded. San Diego then executed a delayed double-steal allowing Fernando Tatis, Jr., to score from third.
Aranda hit a 453-foot home run to center field in the third. Caminero ended a 15-game homer drought with a solo shot in the sixth.
How can I watch San Diego Padres vs. Tampa Bay Rays?
- TV Channel: Padres at Rays 2022 MLB Baseball, is broadcasted on MLB.TV.
- Online streaming: Sign up for Fubo.
Scoring Summary
 |
9th Inning | Merrill grounded out to second. |
|
9th Inning | France struck out swinging. |
|
9th Inning | Bowen ran for Machado |
|
9th Inning | Machado walked. |
|
9th Inning | Cronenworth grounded out to second. |
 |
9th Inning | Baker relieved Kelly |
Statistics
 SD |
 TB |
|
|---|---|---|
| 1 | Games Played | 1 |
| 1 | Team Games Played | 1 |
| 0 | Hit By Pitch | 0 |
| 14 | Ground Balls | 14 |
| 8 | Strikeouts | 7 |
| 5 | Runs Batted In | 5 |
| 0 | Sacrifice Hit | 0 |
| 10 | Hits | 11 |
| 3 | Stolen Bases | 0 |
| 4 | Walks | 3 |
| 0 | Catcher Interference | 0 |
| 6 | Runs | 7 |
| 0 | Ground Into Double Play | 1 |
| 0 | Sacrifice Flies | 0 |
| 37 | At Bats | 34 |
| 1 | Home Runs | 2 |
| 0 | Grand Slam Home Runs | 0 |
| 18 | Runners Left On Base | 13 |
| 0 | Triples | 0 |
| 0 | Game Winning RBIs | 1 |
| 1 | Intentional Walks | 1 |
| 1 | Doubles | 1 |
| 15 | Fly Balls | 13 |
| 0 | Caught Stealing | 0 |
| 134 | Pitches | 130 |
| 0 | Games Started | 0 |
| 0 | Pinch At Bats | 1 |
| 0 | Pinch Hits | 0 |
| 0.0 | Player Rating | 0.0 |
| 1 | Is Qualified | 1 |
| 1 | Is Qualified In Steals | 0 |
| 14 | Total Bases | 18 |
| 41 | Plate Appearances | 37 |
| 162.0 | Projected Home Runs | 324.0 |
| 2 | Extra Base Hits | 3 |
| 5.7 | Runs Created | 6.3 |
| .270 | Batting Average | .324 |
| .000 | Pinch Hit Average | .000 |
| .378 | Slugging Percentage | .529 |
| .297 | Secondary Average | .294 |
| .341 | On Base Percentage | .378 |
| .720 | OBP Pct + SLG Pct | .908 |
| 0.9 | Ground To Fly Ball Ratio | 1.1 |
| 5.7 | Runs Created Per 27 Outs | 7.1 |
| 40.0 | Batter Rating | 43.0 |
| 37.0 | At Bats Per Home Run | 17.0 |
| 1.00 | Stolen Base Percentage | 0.00 |
| 3.27 | Pitches Per Plate Appearance | 3.51 |
| .108 | Isolated Power | .206 |
| 0.50 | Walk To Strikeout Ratio | 0.43 |
| .098 | Walks Per Plate Appearance | .081 |
| .027 | Secondary Average Minus Batting Average | -.029 |
| 11.0 | Runs Produced | 12.0 |
| 0.8 | Runs Ratio | 0.7 |
| 0.4 | Patience Ratio | 0.6 |
| 0.3 | Balls In Play Average | 0.4 |
| 87.0 | MLB Rating | 93.3 |
| 0.0 | Offensive Wins Above Replacement | 0.0 |
| 0.0 | Wins Above Replacement | 0.0 |
Game Information
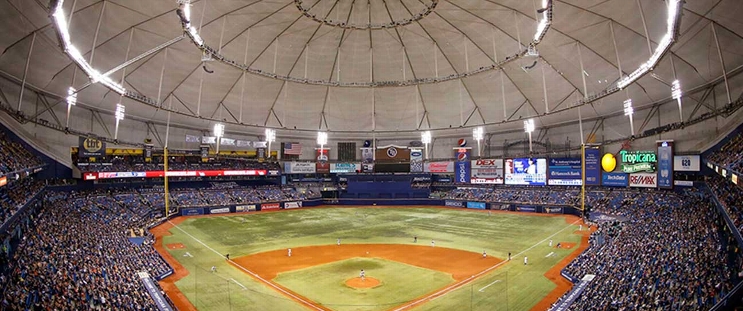
Location: St. Petersburg, Florida
Attendance: 25,621 | Capacity:
2026 National League West Standings
| TEAM | W | L | PCT | GB | STRK |
|---|---|---|---|---|---|
 Los Angeles |
- | 62 | W3 | 0.61728394 | 100 |
| San Diego |
9 | 71 | W2 | 0.5617284 | 91 |
 Arizona |
14 | 76 | L2 | 0.5308642 | 86 |
 San Francisco |
35 | 97 | L5 | 0.40123457 | 65 |
 Colorado |
42 | 104 | L1 | 0.3580247 | 58 |
2026 American League East Standings
| TEAM | W | L | PCT | GB | STRK |
|---|---|---|---|---|---|
| Tampa Bay |
- | 64 | L1 | 0.60493827 | 98 |
 New York |
4.5 | 68 | W1 | 0.57763976 | 93 |
 Boston |
11 | 75 | L1 | 0.537037 | 87 |
 Baltimore |
18.5 | 82 | L1 | 0.49068323 | 79 |
 Toronto |
19 | 83 | W1 | 0.48765433 | 79 |