
San Diego Padres at Tampa Bay Rays
· Major League Baseball
4 - 9

Diaz, Mullins homers power AL-leading Rays to a 9-4 win over the Padres for 80th victory

Shane McClanahan (10-6) allowed three hits and four runs, three earned, with two walks and four strikeouts in 5 2/3 innings. The 29-year-old left-hander improved to 8-1 at home.
Chandler Simpson had two hits, two stolen bases and scored twice as the Rays (80-54) won for the fourth time in five games and became the first team in the American League to reach 80 wins.
Casey Mize (5-8) allowed seven runs, two earned, on six hits in five innings. Jackson Merrill homered for San Diego, which is 8-2 in its last 10 games.
Diaz hit an opposite field homer to right for his 20th of the season, opening the scoring in the third. He moved into fifth place in franchise history with 119 homers and into fourth place for RBI with 470.
Tampa Bay sent nine batters to the plate in the fourth, scoring five runs on two hits — both two-out singles by Taylor Walls and Diaz — to open a 6-0 lead.
Jonny DeLuca made it 7-2 with a two-out single in the bottom of the fifth, before Merrill hit a two-run homer in the sixth to make it 7-4.
Caminero singled in a run in the sixth and Mullins hit a solo home run in the seventh.
See AP’s full MLB coverage here
How can I watch San Diego Padres vs. Tampa Bay Rays?
- TV Channel: Padres at Rays 2022 MLB Baseball, is broadcasted on MLB.TV.
- Online streaming: Sign up for Fubo.
Scoring Summary
 |
9th Inning | Fermin lined out to center. |
|
9th Inning | Hays grounded out to second. |
|
9th Inning | Bogaerts flied out to right. |
 |
8th Inning | Piper struck out swinging. |
|
8th Inning | Caminero grounded into fielder's choice to third, Aranda out at second. |
|
8th Inning | Aranda singled to center. |
Statistics
 SD |
 TB |
|
|---|---|---|
| 1 | Games Played | 1 |
| 1 | Team Games Played | 1 |
| 0 | Hit By Pitch | 1 |
| 12 | Ground Balls | 13 |
| 5 | Strikeouts | 6 |
| 4 | Runs Batted In | 8 |
| 0 | Sacrifice Hit | 0 |
| 4 | Hits | 11 |
| 0 | Stolen Bases | 3 |
| 3 | Walks | 2 |
| 0 | Catcher Interference | 0 |
| 4 | Runs | 9 |
| 0 | Ground Into Double Play | 0 |
| 0 | Sacrifice Flies | 1 |
| 32 | At Bats | 36 |
| 1 | Home Runs | 2 |
| 0 | Grand Slam Home Runs | 0 |
| 10 | Runners Left On Base | 14 |
| 0 | Triples | 0 |
| 0 | Game Winning RBIs | 1 |
| 0 | Intentional Walks | 0 |
| 0 | Doubles | 1 |
| 15 | Fly Balls | 18 |
| 0 | Caught Stealing | 0 |
| 126 | Pitches | 141 |
| 0 | Games Started | 0 |
| 0 | Pinch At Bats | 1 |
| 0 | Pinch Hits | 0 |
| 0.0 | Player Rating | 0.0 |
| 1 | Is Qualified | 1 |
| 0 | Is Qualified In Steals | 1 |
| 7 | Total Bases | 18 |
| 35 | Plate Appearances | 40 |
| 162.0 | Projected Home Runs | 324.0 |
| 1 | Extra Base Hits | 3 |
| 1.0 | Runs Created | 7.1 |
| .125 | Batting Average | .306 |
| .000 | Pinch Hit Average | .000 |
| .219 | Slugging Percentage | .500 |
| .188 | Secondary Average | .333 |
| .200 | On Base Percentage | .350 |
| .419 | OBP Pct + SLG Pct | .850 |
| 0.8 | Ground To Fly Ball Ratio | 0.7 |
| 1.0 | Runs Created Per 27 Outs | 7.4 |
| 23.0 | Batter Rating | 56.0 |
| 32.0 | At Bats Per Home Run | 18.0 |
| 0.00 | Stolen Base Percentage | 1.00 |
| 3.60 | Pitches Per Plate Appearance | 3.53 |
| .094 | Isolated Power | .194 |
| 0.60 | Walk To Strikeout Ratio | 0.33 |
| .086 | Walks Per Plate Appearance | .050 |
| .063 | Secondary Average Minus Batting Average | .028 |
| 8.0 | Runs Produced | 17.0 |
| 1.0 | Runs Ratio | 0.9 |
| 0.3 | Patience Ratio | 0.5 |
| 0.1 | Balls In Play Average | 0.3 |
| 70.5 | MLB Rating | 99.0 |
| 0.0 | Offensive Wins Above Replacement | 0.0 |
| 0.0 | Wins Above Replacement | 0.0 |
Game Information
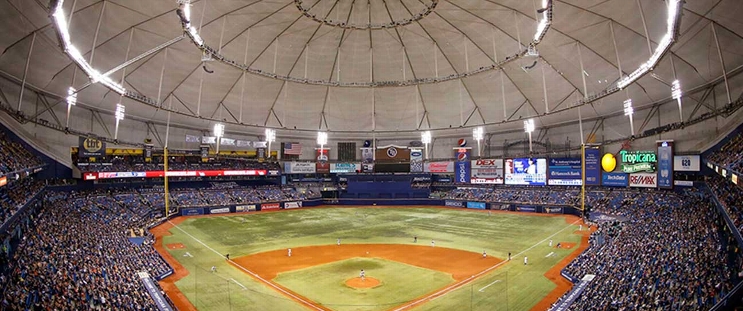
Location: St. Petersburg, Florida
Attendance: 16,470 | Capacity:
2026 National League West Standings
| TEAM | W | L | PCT | GB | STRK |
|---|---|---|---|---|---|
 Los Angeles |
- | 62 | W3 | 0.61728394 | 100 |
| San Diego |
9 | 71 | W2 | 0.5617284 | 91 |
 Arizona |
14 | 76 | L2 | 0.5308642 | 86 |
 San Francisco |
35 | 97 | L5 | 0.40123457 | 65 |
 Colorado |
42 | 104 | L1 | 0.3580247 | 58 |
2026 American League East Standings
| TEAM | W | L | PCT | GB | STRK |
|---|---|---|---|---|---|
| Tampa Bay |
- | 64 | L1 | 0.60493827 | 98 |
 New York |
4.5 | 68 | W1 | 0.57763976 | 93 |
 Boston |
11 | 75 | L1 | 0.537037 | 87 |
 Baltimore |
18.5 | 82 | L1 | 0.49068323 | 79 |
 Toronto |
19 | 83 | W1 | 0.48765433 | 79 |