
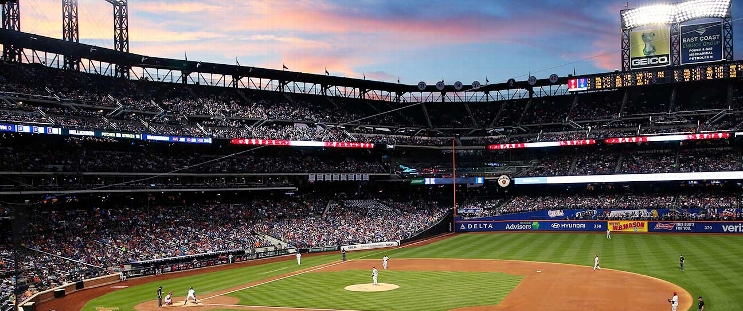
Milwaukee Brewers at New York Mets
· Major League Baseball
8 - 2

Jackson Chourio and Jacob Misiorowski lead the Brewers to an 8-2 victory over the Mets

Misiorowski (14-5) overcame some command issues and reduced velocity — at least by his standards — to allow two hits and strike out six over six innings.
Both hits he gave up came in the fifth, when Jacob Young had an RBI double and Christopher Morel laced a run-scoring single.
Nine of Misiorowski’s 95 pitches were clocked at 100 mph, with none reaching 101 mph. He walked two batters for the second consecutive outing after issuing four walks in seven starts from July 2 through Aug. 15.
The 6-foot-7 right-hander appeared to have issues with his landing foot on the slippery Citi Field mound. Brewers manager Pat Murphy had a discussion with third base umpire and crew chief Vic Carapazza in the third, when Misiorowski fell behind 2-0 on Francisco Alvarez following a walk to Morel. The grounds crew spent a few minutes working on the mound before the bottom of the fourth.
Andrew Vaughn, Gary Sánchez, William Contreras and Cooper Pratt each had an RBI for the Brewers (83-51), who are three games ahead of the Los Angeles Dodgers for the best record in the big leagues.
Batting leadoff, Chourio hit two-run shots off Sean Manaea (4-6) in the first and Xzavion Curry in the eighth. The two-homer game was the third this season for Chourio and fifth of his career — plus another one in the 2024 playoffs against the Mets.
Manaea gave up six runs and eight hits in 5 2/3 innings as Milwaukee took two of three games in the series.
Mets: RHP Christian Scott (4-3, 3.73 ERA) starts Friday at home against RHP Hunter Brown (3-3, 3.51) and the Houston Astros.
See AP’s full MLB coverage here
How can I watch Milwaukee Brewers vs. New York Mets?
- TV Channel: Brewers at Mets 2022 MLB Baseball, is broadcasted on MLB.TV.
- Online streaming: Sign up for Fubo.
Scoring Summary
 |
9th Inning | Semien grounded out to catcher. |
|
9th Inning | Young flied out to center. |
|
9th Inning | Robert Jr. singled to right. |
|
9th Inning | Benge grounded out to second. |
 |
9th Inning | Patrick relieved Hall |
|
9th Inning | Frelick struck out swinging. |
Statistics
 MIL |
 NYM |
|
|---|---|---|
| 1 | Games Played | 1 |
| 1 | Team Games Played | 1 |
| 2 | Hit By Pitch | 0 |
| 17 | Ground Balls | 10 |
| 7 | Strikeouts | 9 |
| 8 | Runs Batted In | 2 |
| 0 | Sacrifice Hit | 0 |
| 12 | Hits | 3 |
| 2 | Stolen Bases | 0 |
| 2 | Walks | 3 |
| 0 | Catcher Interference | 0 |
| 8 | Runs | 2 |
| 0 | Ground Into Double Play | 1 |
| 1 | Sacrifice Flies | 0 |
| 38 | At Bats | 30 |
| 2 | Home Runs | 0 |
| 0 | Grand Slam Home Runs | 0 |
| 18 | Runners Left On Base | 11 |
| 1 | Triples | 0 |
| 1 | Game Winning RBIs | 0 |
| 0 | Intentional Walks | 0 |
| 1 | Doubles | 1 |
| 15 | Fly Balls | 11 |
| 0 | Caught Stealing | 0 |
| 167 | Pitches | 137 |
| 0 | Games Started | 0 |
| 0 | Pinch At Bats | 0 |
| 0 | Pinch Hits | 0 |
| 0.0 | Player Rating | 0.0 |
| 1 | Is Qualified | 1 |
| 1 | Is Qualified In Steals | 0 |
| 21 | Total Bases | 4 |
| 43 | Plate Appearances | 33 |
| 324.0 | Projected Home Runs | 0.0 |
| 4 | Extra Base Hits | 1 |
| 8.3 | Runs Created | -0.4 |
| .316 | Batting Average | .100 |
| .000 | Pinch Hit Average | .000 |
| .553 | Slugging Percentage | .133 |
| .342 | Secondary Average | .133 |
| .372 | On Base Percentage | .182 |
| .925 | OBP Pct + SLG Pct | .315 |
| 1.1 | Ground To Fly Ball Ratio | 0.9 |
| 8.3 | Runs Created Per 27 Outs | -0.3 |
| 56.5 | Batter Rating | 13.0 |
| 19.0 | At Bats Per Home Run | 0.0 |
| 1.00 | Stolen Base Percentage | 0.00 |
| 3.88 | Pitches Per Plate Appearance | 4.15 |
| .237 | Isolated Power | .033 |
| 0.29 | Walk To Strikeout Ratio | 0.33 |
| .047 | Walks Per Plate Appearance | .091 |
| .026 | Secondary Average Minus Batting Average | .033 |
| 16.0 | Runs Produced | 4.0 |
| 1.0 | Runs Ratio | 1.0 |
| 0.6 | Patience Ratio | 0.2 |
| 0.3 | Balls In Play Average | 0.1 |
| 101.5 | MLB Rating | 61.8 |
| 0.0 | Offensive Wins Above Replacement | 0.0 |
| 0.0 | Wins Above Replacement | 0.0 |
Game Information
Location: Queens, New York
Attendance: 26,611 | Capacity:
2026 National League Central Standings
| TEAM | W | L | PCT | GB | STRK |
|---|---|---|---|---|---|
| Milwaukee |
- | 59 | W5 | 0.63580245 | 103 |
 Chicago |
14 | 73 | W1 | 0.5493827 | 89 |
 Pittsburgh |
21 | 80 | W1 | 0.50617284 | 82 |
 St. Louis |
26 | 85 | L4 | 0.47530866 | 77 |
 Cincinnati |
28 | 87 | L1 | 0.46296296 | 75 |
2026 National League East Standings
| TEAM | W | L | PCT | GB | STRK |
|---|---|---|---|---|---|
 Atlanta |
- | 68 | L1 | 0.5802469 | 94 |
 Philadelphia |
6 | 74 | W1 | 0.54320985 | 88 |
 Miami |
14 | 82 | W1 | 0.49382716 | 80 |
 Washington |
17 | 85 | W1 | 0.47530866 | 77 |
| New York |
20 | 88 | L1 | 0.45679012 | 74 |