
Pittsburgh Pirates at San Diego Padres
· Major League Baseball
0 - 3

Merrill, Vásquez lead the Padres to a 3-0 victory over the Pirates

The Padres remained in possession of the National League's third wild-card spot, one game ahead of the Arizona Diamondbacks. San Diego has won 12 of 17 and 22 of 31.
Merrill doubled to right with one out in the second off Bubba Chandler and scored on Luis Rengifo's single to right.
Manny Machado reached on third baseman Nick Gonzales' throwing error with one out in the fourth and came around on Merrill's triple to the right-field wall, sliding in headfirst and dragging his left hand across the plate.
Jake Cronenworth hit an RBI double in the eighth. Merrill drew an 11-pitch walk with two outs to load the bases before Jase Bowen flied out.
Vásquez retired his first nine batters before loading the bases with two outs in the fourth. He struck out Nick Gonzales to end it after catcher Freddy Fermin challenged a ball call that was overturned by the ABS system.
The right-hander held the Pirates to one hit in five innings, with two strikeouts and two walks. He has four wins and a no-decision in his last five starts. His previous high for victories in a season was six in 2025.
Griffin Canning got out of a bases-loaded jam in the seventh.
Bradgley Rodriguez pitched the final two innings for his second save. It was San Diego's 10th shutout.
The Pirates stranded 10 runners and were 1 for 13 with runners in scoring position.
Chandler (6-9) allowed two runs, one earned, and four hits in 5 2/3 innings. He struck out three and walked two.
The Padres haven't announced starter for the opener of a three-game series Friday night at Tampa Bay.
How can I watch Pittsburgh Pirates vs. San Diego Padres?
- TV Channel: Pirates at Padres 2022 MLB Baseball, is broadcasted on MLB.TV.
- Online streaming: Sign up for Fubo.
Scoring Summary
 |
9th Inning | Horwitz popped out to shortstop. |
|
9th Inning | Triolo grounded out to first. |
|
9th Inning | Flores Jr. lined out to left. |
 |
8th Inning | Bowen flied out to center. |
|
8th Inning | Murdock relieved Yates |
|
8th Inning | Merrill walked, France to second, Machado to third. |
Statistics
 PIT |
 SD |
|
|---|---|---|
| 1 | Games Played | 1 |
| 1 | Team Games Played | 1 |
| 1 | Hit By Pitch | 0 |
| 14 | Ground Balls | 8 |
| 7 | Strikeouts | 5 |
| 0 | Runs Batted In | 3 |
| 0 | Sacrifice Hit | 0 |
| 5 | Hits | 7 |
| 0 | Stolen Bases | 1 |
| 4 | Walks | 4 |
| 0 | Catcher Interference | 0 |
| 0 | Runs | 3 |
| 0 | Ground Into Double Play | 1 |
| 0 | Sacrifice Flies | 0 |
| 32 | At Bats | 29 |
| 0 | Home Runs | 0 |
| 0 | Grand Slam Home Runs | 0 |
| 27 | Runners Left On Base | 9 |
| 0 | Triples | 1 |
| 0 | Game Winning RBIs | 1 |
| 0 | Intentional Walks | 0 |
| 0 | Doubles | 2 |
| 11 | Fly Balls | 16 |
| 0 | Caught Stealing | 1 |
| 152 | Pitches | 139 |
| 0 | Games Started | 0 |
| 1 | Pinch At Bats | 0 |
| 1 | Pinch Hits | 0 |
| 0.0 | Player Rating | 0.0 |
| 1 | Is Qualified | 1 |
| 0 | Is Qualified In Steals | 1 |
| 5 | Total Bases | 11 |
| 37 | Plate Appearances | 33 |
| 0.0 | Projected Home Runs | 0.0 |
| 0 | Extra Base Hits | 3 |
| 1.4 | Runs Created | 3.4 |
| .156 | Batting Average | .241 |
| 1.000 | Pinch Hit Average | .000 |
| .156 | Slugging Percentage | .379 |
| .125 | Secondary Average | .276 |
| .270 | On Base Percentage | .333 |
| .427 | OBP Pct + SLG Pct | .713 |
| 1.3 | Ground To Fly Ball Ratio | 0.5 |
| 1.4 | Runs Created Per 27 Outs | 3.8 |
| 5.0 | Batter Rating | 26.5 |
| 0.0 | At Bats Per Home Run | 0.0 |
| 0.00 | Stolen Base Percentage | 0.50 |
| 4.11 | Pitches Per Plate Appearance | 4.21 |
| .000 | Isolated Power | .138 |
| 0.57 | Walk To Strikeout Ratio | 0.80 |
| .108 | Walks Per Plate Appearance | .121 |
| -.031 | Secondary Average Minus Batting Average | .034 |
| 0.0 | Runs Produced | 6.0 |
| 0.0 | Runs Ratio | 1.0 |
| 0.3 | Patience Ratio | 0.5 |
| 0.2 | Balls In Play Average | 0.3 |
| 61.8 | MLB Rating | 77.3 |
| 0.0 | Offensive Wins Above Replacement | 0.0 |
| 0.0 | Wins Above Replacement | 0.0 |
Game Information
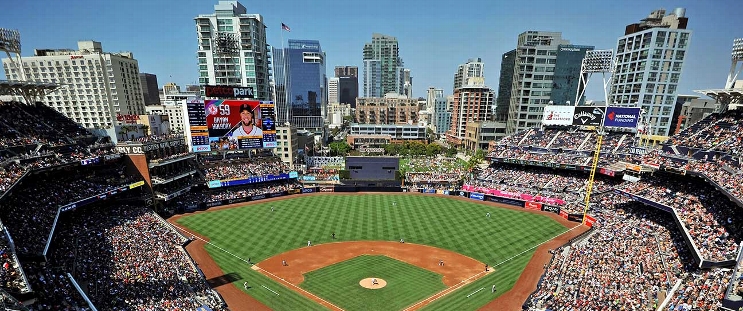
Location: San Diego, California
Attendance: 40,413 | Capacity:
2026 National League Central Standings
| TEAM | W | L | PCT | GB | STRK |
|---|---|---|---|---|---|
 Milwaukee |
- | 59 | W5 | 0.63580245 | 103 |
 Chicago |
14 | 73 | W1 | 0.5493827 | 89 |
| Pittsburgh |
21 | 80 | W1 | 0.50617284 | 82 |
 St. Louis |
26 | 85 | L4 | 0.47530866 | 77 |
 Cincinnati |
28 | 87 | L1 | 0.46296296 | 75 |
2026 National League West Standings
| TEAM | W | L | PCT | GB | STRK |
|---|---|---|---|---|---|
 Los Angeles |
- | 62 | W3 | 0.61728394 | 100 |
| San Diego |
9 | 71 | W2 | 0.5617284 | 91 |
 Arizona |
14 | 76 | L2 | 0.5308642 | 86 |
 San Francisco |
35 | 97 | L5 | 0.40123457 | 65 |
 Colorado |
42 | 104 | L1 | 0.3580247 | 58 |