
Tampa Bay Rays at Detroit Tigers
· Major League Baseball
1 - 4

Max Clark, pitching staff help Tigers end six-game losing streak with 4-1 win over Rays

Clark's homer, the second of his career, gave the Tigers a 2-1 lead in the fifth inning, and that was more than enough for Detroit's pitching staff. Starter Jackson Jobe allowed one run in 4 1/3 innings, and four relievers combined to allow one hit.
Drew Sommers (1-3) retired all five batters he faced for his first major league victory and Kenley Jansen pitched the ninth for his 17th save.
Detroit had lost nine of its last 10 to fall 4 1/2 games behind Cleveland in the race for the third AL wild card.
Ian Seymour (9-5), who replaced Tampa Bay opener Casey Legumina, gave up four runs, three earned, on seven hits in 5 2/3 innings. The Rays have lost eight of their last 12 games.
Tampa Bay took a 1-0 lead in the fourth when Junior Caminero singled, took third on Liam Hicks' double and scored on an infield single by Jonny DeLuca.
Detroit scored three times in the fifth. After Clark's homer, the Tigers added another run in the inning when Gleyber Torres reached on a pop fly that dropped between second baseman Richie Palacios and DeLuca in right.
Seymour balked, moving Torres to second, and he scored when Jonathan Aranda misplayed Kevin McGonigle's ground ball.
Detroit added a fourth run in the seventh when Javier Báez tripled and scored on Hao-Yu Lee's single to left.
See AP’s full MLB coverage here
How can I watch Tampa Bay Rays vs. Detroit Tigers?
- TV Channel: Rays at Tigers 2022 MLB Baseball, is broadcasted on MLB.TV.
- Online streaming: Sign up for Fubo.
Scoring Summary
 |
9th Inning | Palacios fouled out to third. |
|
9th Inning | Mullins struck out looking. |
|
9th Inning | DeLuca flied out to left. |
 |
9th Inning | Jansen relieved Holton |
|
8th Inning | McKinstry lined out to right. |
|
8th Inning | Valencia struck out swinging. |
Statistics
 TB |
 DET |
|
|---|---|---|
| 1 | Games Played | 1 |
| 1 | Team Games Played | 1 |
| 0 | Hit By Pitch | 0 |
| 15 | Ground Balls | 9 |
| 7 | Strikeouts | 7 |
| 1 | Runs Batted In | 3 |
| 0 | Sacrifice Hit | 0 |
| 5 | Hits | 8 |
| 0 | Stolen Bases | 0 |
| 4 | Walks | 0 |
| 0 | Catcher Interference | 0 |
| 1 | Runs | 4 |
| 0 | Ground Into Double Play | 0 |
| 0 | Sacrifice Flies | 0 |
| 31 | At Bats | 33 |
| 0 | Home Runs | 1 |
| 0 | Grand Slam Home Runs | 0 |
| 12 | Runners Left On Base | 11 |
| 0 | Triples | 1 |
| 0 | Game Winning RBIs | 1 |
| 0 | Intentional Walks | 0 |
| 1 | Doubles | 1 |
| 9 | Fly Balls | 17 |
| 1 | Caught Stealing | 0 |
| 150 | Pitches | 115 |
| 0 | Games Started | 0 |
| 0 | Pinch At Bats | 0 |
| 0 | Pinch Hits | 0 |
| 0.0 | Player Rating | 0.0 |
| 1 | Is Qualified | 1 |
| 1 | Is Qualified In Steals | 0 |
| 6 | Total Bases | 14 |
| 35 | Plate Appearances | 33 |
| 0.0 | Projected Home Runs | 162.0 |
| 1 | Extra Base Hits | 3 |
| 1.2 | Runs Created | 3.4 |
| .161 | Batting Average | .242 |
| .000 | Pinch Hit Average | .000 |
| .194 | Slugging Percentage | .424 |
| .129 | Secondary Average | .182 |
| .257 | On Base Percentage | .242 |
| .451 | OBP Pct + SLG Pct | .667 |
| 1.7 | Ground To Fly Ball Ratio | 0.5 |
| 1.2 | Runs Created Per 27 Outs | 3.7 |
| 11.0 | Batter Rating | 29.5 |
| 0.0 | At Bats Per Home Run | 33.0 |
| 0.00 | Stolen Base Percentage | 0.00 |
| 4.29 | Pitches Per Plate Appearance | 3.48 |
| .032 | Isolated Power | .182 |
| 0.57 | Walk To Strikeout Ratio | 0.00 |
| .114 | Walks Per Plate Appearance | .000 |
| -.032 | Secondary Average Minus Batting Average | -.061 |
| 2.0 | Runs Produced | 7.0 |
| 1.0 | Runs Ratio | 0.8 |
| 0.3 | Patience Ratio | 0.4 |
| 0.2 | Balls In Play Average | 0.3 |
| 64.5 | MLB Rating | 80.0 |
| 0.0 | Offensive Wins Above Replacement | 0.0 |
| 0.0 | Wins Above Replacement | 0.0 |
Game Information
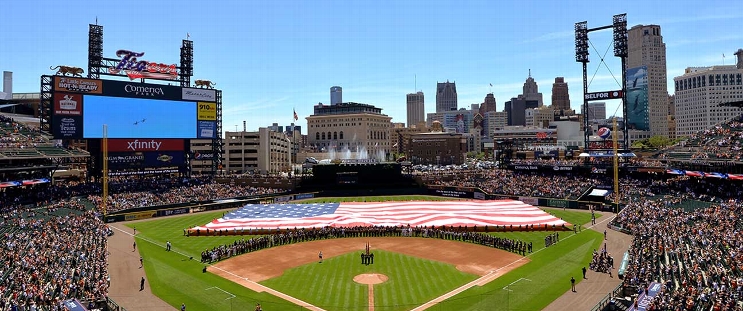
Location: Detroit, Michigan
Attendance: 26,605 | Capacity:
2026 American League East Standings
| TEAM | W | L | PCT | GB | STRK |
|---|---|---|---|---|---|
| Tampa Bay |
- | 64 | L1 | 0.60493827 | 98 |
 New York |
4.5 | 68 | W1 | 0.57763976 | 93 |
 Boston |
11 | 75 | L1 | 0.537037 | 87 |
 Baltimore |
18.5 | 82 | L1 | 0.49068323 | 79 |
 Toronto |
19 | 83 | W1 | 0.48765433 | 79 |
2026 American League Central Standings
| TEAM | W | L | PCT | GB | STRK |
|---|---|---|---|---|---|
 Cleveland |
- | 77 | L1 | 0.52469134 | 85 |
 Chicago |
1 | 78 | W1 | 0.5185185 | 84 |
 Minnesota |
8 | 85 | W1 | 0.47530866 | 77 |
| Detroit |
9 | 86 | L1 | 0.4691358 | 76 |
 Kansas City |
16 | 93 | W1 | 0.42592594 | 69 |