
Cincinnati Reds at San Francisco Giants
· Major League Baseball
0 - 5

Rafael Devers hits three-run homer to highlight Giants' 5-0 win over Reds, San Francisco ends skid

Jason Foley (1-1) worked 1 1/3 innings for the win after relieving lefty Carson Whisenhunt, who left in the third inning with pain in his pitching elbow. He was coming off an outing in which he surrendered a career-worst seven runs and nine hits over four innings of an 8-1 loss at Cleveland last Tuesday. He will have an MRI on Tuesday.
San Francisco leadoff hitter Drew Gilbert doubled in each of his first two at-bats on a cool night and well before the mist began hovering over the outfield in the middle innings.
The Giants began the game with four straight hits off right-hander Chase Burns (14-3), including Jung Hoo Lee’s RBI single followed by a run-scoring double from Turner Hill in the first. Two of Burns' three losses this year have come in his last three outings.
There appeared to be no lingering ill will in the first meeting between the clubs since a three-game series at Cincinnati in mid-April that featured a benches-clearing brawl.
The Reds were shut out for the14th time this season, tied for the most in the majors this season.
Lee received a break from his duties in right field and was designated hitter after a late flight home from Boston as the Giants concluded a 1-5 road trip. San Francisco won for just the second time in eight games.
San Francisco placed infielder Bryce Eldridge on the bereavement list while infielder Willy Adames went on the 10-day injured list with a sprained left elbow. Outfielder Victor Bericoto also is on the IL because of a bone bruise in his right knee.
See AP’s full MLB coverage here
How can I watch Cincinnati Reds vs. San Francisco Giants?
- TV Channel: Reds at Giants 2022 MLB Baseball, is broadcasted on MLB.TV.
- Online streaming: Sign up for Fubo.
Scoring Summary
 |
9th Inning | Bleday popped out to shortstop. |
|
9th Inning | McLain flied out to center. |
|
9th Inning | Suárez singled to left, Stephenson to second. |
|
9th Inning | Stephenson walked. |
|
9th Inning | Myers struck out swinging. |
 |
9th Inning | Smith relieved Seymour |
Statistics
 CIN |
 SF |
|
|---|---|---|
| 1 | Games Played | 1 |
| 1 | Team Games Played | 1 |
| 0 | Hit By Pitch | 0 |
| 7 | Ground Balls | 8 |
| 11 | Strikeouts | 7 |
| 0 | Runs Batted In | 5 |
| 0 | Sacrifice Hit | 0 |
| 5 | Hits | 10 |
| 0 | Stolen Bases | 1 |
| 2 | Walks | 1 |
| 0 | Catcher Interference | 0 |
| 0 | Runs | 5 |
| 0 | Ground Into Double Play | 1 |
| 0 | Sacrifice Flies | 0 |
| 32 | At Bats | 32 |
| 0 | Home Runs | 1 |
| 0 | Grand Slam Home Runs | 0 |
| 14 | Runners Left On Base | 9 |
| 0 | Triples | 1 |
| 0 | Game Winning RBIs | 1 |
| 0 | Intentional Walks | 0 |
| 0 | Doubles | 3 |
| 14 | Fly Balls | 17 |
| 0 | Caught Stealing | 0 |
| 138 | Pitches | 111 |
| 0 | Games Started | 0 |
| 0 | Pinch At Bats | 0 |
| 0 | Pinch Hits | 0 |
| 0.0 | Player Rating | 0.0 |
| 1 | Is Qualified | 1 |
| 0 | Is Qualified In Steals | 1 |
| 5 | Total Bases | 18 |
| 34 | Plate Appearances | 33 |
| 0.0 | Projected Home Runs | 162.0 |
| 0 | Extra Base Hits | 5 |
| 0.4 | Runs Created | 5.6 |
| .156 | Batting Average | .313 |
| .000 | Pinch Hit Average | .000 |
| .156 | Slugging Percentage | .563 |
| .063 | Secondary Average | .313 |
| .206 | On Base Percentage | .333 |
| .362 | OBP Pct + SLG Pct | .896 |
| 0.5 | Ground To Fly Ball Ratio | 0.5 |
| 0.4 | Runs Created Per 27 Outs | 6.6 |
| 5.0 | Batter Rating | 42.5 |
| 0.0 | At Bats Per Home Run | 32.0 |
| 0.00 | Stolen Base Percentage | 1.00 |
| 4.06 | Pitches Per Plate Appearance | 3.36 |
| .000 | Isolated Power | .250 |
| 0.18 | Walk To Strikeout Ratio | 0.14 |
| .059 | Walks Per Plate Appearance | .030 |
| -.094 | Secondary Average Minus Batting Average | .000 |
| 0.0 | Runs Produced | 10.0 |
| 0.0 | Runs Ratio | 1.0 |
| 0.2 | Patience Ratio | 0.6 |
| 0.2 | Balls In Play Average | 0.4 |
| 60.0 | MLB Rating | 90.3 |
| 0.0 | Offensive Wins Above Replacement | 0.0 |
| 0.0 | Wins Above Replacement | 0.0 |
Game Information
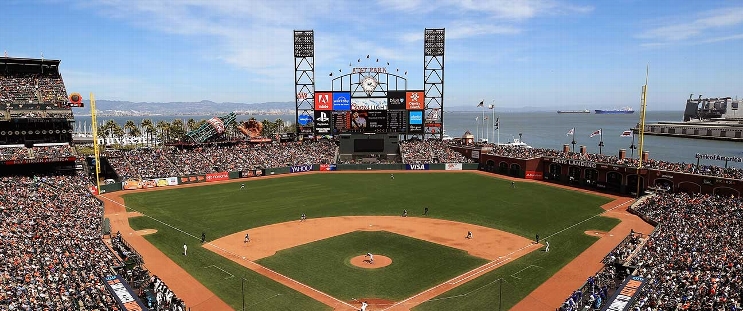
Location: San Francisco, California
Attendance: 31,123 | Capacity:
2026 National League Central Standings
| TEAM | W | L | PCT | GB | STRK |
|---|---|---|---|---|---|
 Milwaukee |
- | 59 | W5 | 0.63580245 | 103 |
 Chicago |
14 | 73 | W1 | 0.5493827 | 89 |
 Pittsburgh |
21 | 80 | W1 | 0.50617284 | 82 |
 St. Louis |
26 | 85 | L4 | 0.47530866 | 77 |
| Cincinnati |
28 | 87 | L1 | 0.46296296 | 75 |
2026 National League West Standings
| TEAM | W | L | PCT | GB | STRK |
|---|---|---|---|---|---|
 Los Angeles |
- | 62 | W3 | 0.61728394 | 100 |
 San Diego |
9 | 71 | W2 | 0.5617284 | 91 |
 Arizona |
14 | 76 | L2 | 0.5308642 | 86 |
| San Francisco |
35 | 97 | L5 | 0.40123457 | 65 |
 Colorado |
42 | 104 | L1 | 0.3580247 | 58 |