
San Diego Padres at New York Mets
· Major League Baseball
2 - 4

Carson Benge hits a two-run homer to help the surging Mets past the Padres, 4-2

The fourth-inning homer was the 15th of the season for Benge, who is the first Mets rookie with at least 15 homers and 15 steals since fellow right fielder Darryl Strawberry in 1983.
Benge threw out two runners at the plate in the first inning of Monday’s 2-1 win. He has nine assists this season, including five since Aug. 4 — a span in which the Mets are 11-4 despite a massive sell-off at the trade deadline.
Jared Young capped a two-run eighth with an RBI single.
Nate Lavender (1-0) was credited with the win after retiring all three batters he faced in the sixth. Lavender. Jefry Yan and Jonathan Pintaro all earned their first big league victories on the six-game homestand.
Kodai Senga allowed Gavin Sheets’ pinch-hit RBI single in the ninth before locking down his fourth save in four opportunities in place of the injured Devin Williams.
Mets starter Robert Stock allowed one run and struck out six in 4 1/3 innings. He didn’t allow a hit until Xander Bogaerts led off the fifth with a double.
Fernando Tatis Jr. had an RBI double for the Padres, who entered Wednesday with a two-game lead over the Arizona Diamondbacks in the race for the last National League playoff spot.
Michael King (8-9) gave up two runs and struck out four in 6 2/3 innings.
Mets: Off Thursday before LHP Sean Manaea (4-5, 4.22 ERA) pitches against RHP Sean Burke (7-6, 3.15 ERA) and the AL Central-leading Chicago White Sox.
See AP’s full MLB coverage here
How can I watch San Diego Padres vs. New York Mets?
- TV Channel: Padres at Mets 2022 MLB Baseball, is broadcasted on MLB.TV.
- Online streaming: Sign up for Fubo.
Scoring Summary
 |
9th Inning | Hays grounded into double play, second to first, Sheets out at second. |
|
9th Inning | Hays hit for Song |
|
9th Inning | Sheets singled to right, Rengifo scored, Campusano to third. |
|
9th Inning | Sheets hit for Bowen |
|
9th Inning | Campusano walked, Rengifo to second. |
|
9th Inning | Rengifo singled to left. |
Statistics
 SD |
 NYM |
|
|---|---|---|
| 1 | Games Played | 1 |
| 1 | Team Games Played | 1 |
| 1 | Hit By Pitch | 0 |
| 6 | Ground Balls | 14 |
| 12 | Strikeouts | 4 |
| 2 | Runs Batted In | 4 |
| 0 | Sacrifice Hit | 0 |
| 5 | Hits | 7 |
| 0 | Stolen Bases | 1 |
| 5 | Walks | 3 |
| 0 | Catcher Interference | 0 |
| 2 | Runs | 4 |
| 2 | Ground Into Double Play | 1 |
| 0 | Sacrifice Flies | 0 |
| 30 | At Bats | 30 |
| 0 | Home Runs | 1 |
| 0 | Grand Slam Home Runs | 0 |
| 16 | Runners Left On Base | 9 |
| 0 | Triples | 0 |
| 0 | Game Winning RBIs | 1 |
| 0 | Intentional Walks | 0 |
| 3 | Doubles | 0 |
| 12 | Fly Balls | 12 |
| 0 | Caught Stealing | 0 |
| 153 | Pitches | 131 |
| 0 | Games Started | 0 |
| 2 | Pinch At Bats | 0 |
| 1 | Pinch Hits | 0 |
| 0.0 | Player Rating | 0.0 |
| 1 | Is Qualified | 1 |
| 0 | Is Qualified In Steals | 1 |
| 8 | Total Bases | 10 |
| 36 | Plate Appearances | 33 |
| 0.0 | Projected Home Runs | 162.0 |
| 3 | Extra Base Hits | 1 |
| 2.1 | Runs Created | 3.1 |
| .167 | Batting Average | .233 |
| .500 | Pinch Hit Average | .000 |
| .267 | Slugging Percentage | .333 |
| .267 | Secondary Average | .233 |
| .306 | On Base Percentage | .303 |
| .572 | OBP Pct + SLG Pct | .636 |
| 0.5 | Ground To Fly Ball Ratio | 1.2 |
| 2.1 | Runs Created Per 27 Outs | 3.4 |
| 19.0 | Batter Rating | 27.0 |
| 0.0 | At Bats Per Home Run | 30.0 |
| 0.00 | Stolen Base Percentage | 1.00 |
| 4.25 | Pitches Per Plate Appearance | 3.97 |
| .100 | Isolated Power | .100 |
| 0.42 | Walk To Strikeout Ratio | 0.75 |
| .139 | Walks Per Plate Appearance | .091 |
| .100 | Secondary Average Minus Batting Average | .000 |
| 4.0 | Runs Produced | 8.0 |
| 1.0 | Runs Ratio | 1.0 |
| 0.4 | Patience Ratio | 0.4 |
| 0.3 | Balls In Play Average | 0.2 |
| 68.3 | MLB Rating | 78.3 |
| 0.0 | Offensive Wins Above Replacement | 0.0 |
| 0.0 | Wins Above Replacement | 0.0 |
Game Information
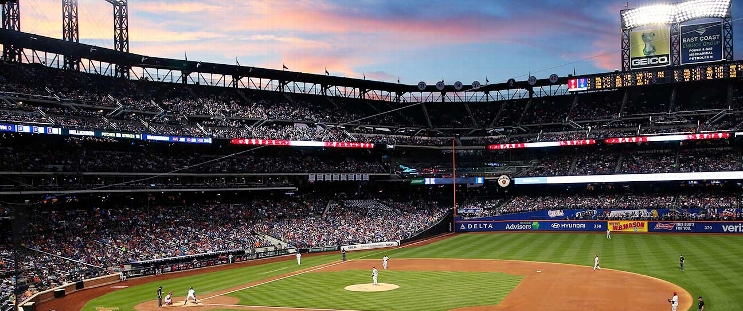
Location: Queens, New York
Attendance: 26,195 | Capacity:
2026 National League West Standings
| TEAM | W | L | PCT | GB | STRK |
|---|---|---|---|---|---|
 Los Angeles |
- | 62 | W3 | 0.61728394 | 100 |
| San Diego |
9 | 71 | W2 | 0.5617284 | 91 |
 Arizona |
14 | 76 | L2 | 0.5308642 | 86 |
 San Francisco |
35 | 97 | L5 | 0.40123457 | 65 |
 Colorado |
42 | 104 | L1 | 0.3580247 | 58 |
2026 National League East Standings
| TEAM | W | L | PCT | GB | STRK |
|---|---|---|---|---|---|
 Atlanta |
- | 68 | L1 | 0.5802469 | 94 |
 Philadelphia |
6 | 74 | W1 | 0.54320985 | 88 |
 Miami |
14 | 82 | W1 | 0.49382716 | 80 |
 Washington |
17 | 85 | W1 | 0.47530866 | 77 |
| New York |
20 | 88 | L1 | 0.45679012 | 74 |