
Boston Red Sox at Pittsburgh Pirates
· Major League Baseball
4 - 8

Lowe, Flores homer to power the Pirates over the slumping Red Sox, 8-4

Lowe’s homer came in the fifth inning off Jovani Moran and landed in the right-field stands, extending the Pirates’ lead to 7-2 as they won back-to-back games for the first time since July 26-27. Flores hit a solo shot off Jake Bennett (7-6) in the second to open the scoring after connecting twice Thursday in a 13-1 victory at Miami.
Rookie Esmerlyn Valdez hit a two-run double in the third and scored on a single by Flores to make it 4-0. Lowe had three hits and Bryan Reynolds added two.
The Red Sox lost for the sixth time in seven games after winning 28 of 36. They had runners on first and second with two outs in the ninth, but Mason Montgomery escaped the jam for his third save.
Rookie Bubba Chandler (6-8) won his third straight start, allowing two runs and four hits in five innings with five strikeouts and two walks. Bennett gave up four runs over four innings while losing for the fourth time in four starts.
Nick Sogard drove in two runs for the Red Sox.
Pirates third baseman Nick Gonzales was struck on the helmet by a pitch from Moran in the fifth inning and left the game. Gonzales, who entered the day third in the NL in hitting, sustained a facial contusion and was replaced by pinch-runner Jacob Gonzalez.
The Pirates said Gonzales is day-to-day. The 27-year-old went 0 for 2, dropping his batting average to .307 in 118 games. He also has six home runs and a career-high 53 RBI.
How can I watch Boston Red Sox vs. Pittsburgh Pirates?
- TV Channel: Red Sox at Pirates 2022 MLB Baseball, is broadcasted on MLB.TV.
- Online streaming: Sign up for Fubo.
Scoring Summary
 |
9th Inning | Rutschman struck out swinging. |
 |
9th Inning | Montgomery relieved Yates |
|
9th Inning | Yoshida singled to right, White scored, Sogard to second. |
|
9th Inning | Sogard singled to center, White to second. |
|
9th Inning | White reached on infield single to second. |
|
9th Inning | Monasterio flied out to right. |
Statistics
 BOS |
 PIT |
|
|---|---|---|
| 1 | Games Played | 1 |
| 1 | Team Games Played | 1 |
| 0 | Hit By Pitch | 1 |
| 12 | Ground Balls | 12 |
| 10 | Strikeouts | 8 |
| 4 | Runs Batted In | 7 |
| 0 | Sacrifice Hit | 1 |
| 9 | Hits | 9 |
| 0 | Stolen Bases | 2 |
| 4 | Walks | 1 |
| 0 | Catcher Interference | 0 |
| 4 | Runs | 8 |
| 0 | Ground Into Double Play | 1 |
| 1 | Sacrifice Flies | 0 |
| 34 | At Bats | 32 |
| 0 | Home Runs | 2 |
| 0 | Grand Slam Home Runs | 0 |
| 15 | Runners Left On Base | 11 |
| 0 | Triples | 0 |
| 0 | Game Winning RBIs | 1 |
| 0 | Intentional Walks | 0 |
| 1 | Doubles | 3 |
| 13 | Fly Balls | 13 |
| 0 | Caught Stealing | 0 |
| 161 | Pitches | 145 |
| 0 | Games Started | 0 |
| 0 | Pinch At Bats | 0 |
| 0 | Pinch Hits | 0 |
| 0.0 | Player Rating | 0.0 |
| 1 | Is Qualified | 1 |
| 0 | Is Qualified In Steals | 1 |
| 10 | Total Bases | 18 |
| 39 | Plate Appearances | 35 |
| 0.0 | Projected Home Runs | 324.0 |
| 1 | Extra Base Hits | 5 |
| 3.9 | Runs Created | 5.8 |
| .265 | Batting Average | .281 |
| .000 | Pinch Hit Average | .000 |
| .294 | Slugging Percentage | .563 |
| .147 | Secondary Average | .375 |
| .333 | On Base Percentage | .324 |
| .627 | OBP Pct + SLG Pct | .886 |
| 0.9 | Ground To Fly Ball Ratio | 0.9 |
| 4.0 | Runs Created Per 27 Outs | 6.3 |
| 27.0 | Batter Rating | 53.0 |
| 0.0 | At Bats Per Home Run | 16.0 |
| 0.00 | Stolen Base Percentage | 1.00 |
| 4.13 | Pitches Per Plate Appearance | 4.14 |
| .029 | Isolated Power | .281 |
| 0.40 | Walk To Strikeout Ratio | 0.13 |
| .103 | Walks Per Plate Appearance | .029 |
| -.118 | Secondary Average Minus Batting Average | .094 |
| 8.0 | Runs Produced | 15.0 |
| 1.0 | Runs Ratio | 0.9 |
| 0.4 | Patience Ratio | 0.6 |
| 0.4 | Balls In Play Average | 0.3 |
| 78.5 | MLB Rating | 94.5 |
| 0.0 | Offensive Wins Above Replacement | 0.0 |
| 0.0 | Wins Above Replacement | 0.0 |
Game Information
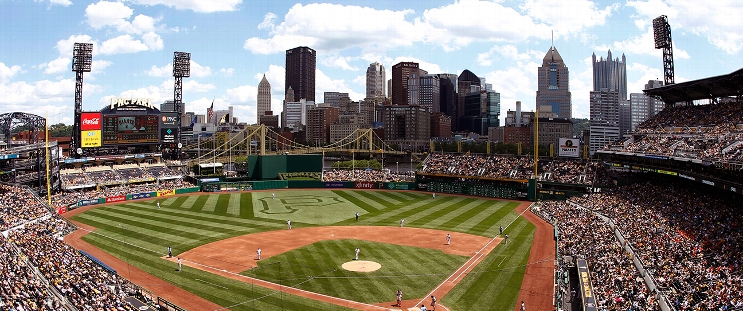
Location: Pittsburgh, Pennsylvania
Attendance: 32,036 | Capacity:
2026 American League East Standings
| TEAM | W | L | PCT | GB | STRK |
|---|---|---|---|---|---|
 Tampa Bay |
- | 64 | L1 | 0.60493827 | 98 |
 New York |
4.5 | 68 | W1 | 0.57763976 | 93 |
| Boston |
11 | 75 | L1 | 0.537037 | 87 |
 Baltimore |
18.5 | 82 | L1 | 0.49068323 | 79 |
 Toronto |
19 | 83 | W1 | 0.48765433 | 79 |
2026 National League Central Standings
| TEAM | W | L | PCT | GB | STRK |
|---|---|---|---|---|---|
 Milwaukee |
- | 59 | W5 | 0.63580245 | 103 |
 Chicago |
14 | 73 | W1 | 0.5493827 | 89 |
| Pittsburgh |
21 | 80 | W1 | 0.50617284 | 82 |
 St. Louis |
26 | 85 | L4 | 0.47530866 | 77 |
 Cincinnati |
28 | 87 | L1 | 0.46296296 | 75 |