
Chicago Cubs at Washington Nationals
· Major League Baseball
8 - 6

Pete Crow-Armstrong hits 27th homer and Cubs beat Nationals 8-6 to move 20 games over .500

Crow-Armstrong's third-inning shot, his 27th, hit the facade of the third deck in right field, traveling an estimated 437 feet.
Bregman hit his 13th homer and finished 2 for 4 with three runs scored. Suzuki hit his 20th in the eighth inning to make it 8-4.
The Cubs (70-50) improved to a season-best 20 games over .500. They were 34-34 on June 10 but have gone 36-16 since, and they have a commanding lead in the NL wild-card race.
All-Star CJ Abrams hit a two-run homer in the first inning for Washington, his 29th, and Jacob Young went deep in the second, his 10th, to give the Nationals a 3-1 lead. Dylan Crews also hit his 10th homer for Washington.
The Cubs scored in five consecutive innings, highlighted by a three-run fourth. Carson Kelly's RBI grounder off Jake Irvin (2-6) put Chicago ahead 4-3.
Shota Imanaga allowed three homers for the fourth time this season and could not get out of the fifth, departing with two outs and a 6-4 lead. Ryan Rolison (7-1) recorded the next four outs.
After the Nationals got within 8-6 in the eighth with two runs against Ryan Zeferjahn, Jacob Webb got the last four outs for his eighth save.
Abrams increased his major league-leading RBI total to 91, matching Ian Desmond in 2014 for the most in a season by a Nationals shortstop. The NL Player of the Month for July, Abrams has 11 homers and 31 RBI in his last 31 games.
How can I watch Chicago Cubs vs. Washington Nationals?
- TV Channel: Cubs at Nationals 2022 MLB Baseball, is broadcasted on MLB.TV.
- Online streaming: Sign up for Fubo.
Scoring Summary
 |
9th Inning | Abrams grounded out to second. |
|
9th Inning | House struck out swinging. |
|
9th Inning | Ortiz singled to right. |
|
9th Inning | Crews struck out swinging. |
 |
9th Inning | Kelly flied out to left. |
|
9th Inning | Hoerner stole second. |
Statistics
 CHC |
 WSH |
|
|---|---|---|
| 1 | Games Played | 1 |
| 1 | Team Games Played | 1 |
| 2 | Hit By Pitch | 1 |
| 9 | Ground Balls | 7 |
| 7 | Strikeouts | 10 |
| 8 | Runs Batted In | 6 |
| 0 | Sacrifice Hit | 0 |
| 9 | Hits | 11 |
| 1 | Stolen Bases | 0 |
| 5 | Walks | 1 |
| 0 | Catcher Interference | 0 |
| 8 | Runs | 6 |
| 0 | Ground Into Double Play | 0 |
| 2 | Sacrifice Flies | 0 |
| 35 | At Bats | 38 |
| 3 | Home Runs | 3 |
| 0 | Grand Slam Home Runs | 0 |
| 17 | Runners Left On Base | 12 |
| 0 | Triples | 0 |
| 1 | Game Winning RBIs | 0 |
| 0 | Intentional Walks | 0 |
| 2 | Doubles | 2 |
| 21 | Fly Balls | 21 |
| 0 | Caught Stealing | 0 |
| 187 | Pitches | 155 |
| 0 | Games Started | 0 |
| 0 | Pinch At Bats | 3 |
| 0 | Pinch Hits | 1 |
| 0.0 | Player Rating | 0.0 |
| 1 | Is Qualified | 1 |
| 1 | Is Qualified In Steals | 0 |
| 20 | Total Bases | 22 |
| 44 | Plate Appearances | 40 |
| 486.0 | Projected Home Runs | 486.0 |
| 5 | Extra Base Hits | 5 |
| 8.1 | Runs Created | 7.1 |
| .257 | Batting Average | .289 |
| .000 | Pinch Hit Average | .333 |
| .571 | Slugging Percentage | .579 |
| .486 | Secondary Average | .316 |
| .364 | On Base Percentage | .325 |
| .935 | OBP Pct + SLG Pct | .904 |
| 0.4 | Ground To Fly Ball Ratio | 0.3 |
| 7.8 | Runs Created Per 27 Outs | 7.1 |
| 55.0 | Batter Rating | 48.0 |
| 11.7 | At Bats Per Home Run | 12.7 |
| 1.00 | Stolen Base Percentage | 0.00 |
| 4.25 | Pitches Per Plate Appearance | 3.88 |
| .314 | Isolated Power | .289 |
| 0.71 | Walk To Strikeout Ratio | 0.10 |
| .114 | Walks Per Plate Appearance | .025 |
| .229 | Secondary Average Minus Batting Average | .026 |
| 16.0 | Runs Produced | 12.0 |
| 1.0 | Runs Ratio | 1.0 |
| 0.7 | Patience Ratio | 0.6 |
| 0.2 | Balls In Play Average | 0.3 |
| 98.3 | MLB Rating | 95.3 |
| 0.0 | Offensive Wins Above Replacement | 0.0 |
| 0.0 | Wins Above Replacement | 0.0 |
Game Information
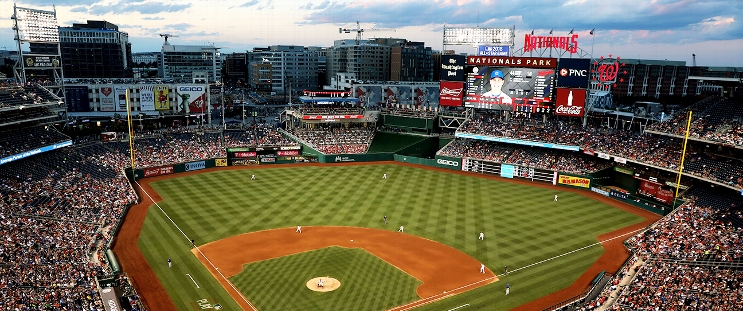
Location: Washington, District of Columbia
Attendance: 23,428 | Capacity:
2026 National League Central Standings
| TEAM | W | L | PCT | GB | STRK |
|---|---|---|---|---|---|
 Milwaukee |
- | 59 | W5 | 0.63580245 | 103 |
| Chicago |
14 | 73 | W1 | 0.5493827 | 89 |
 Pittsburgh |
21 | 80 | W1 | 0.50617284 | 82 |
 St. Louis |
26 | 85 | L4 | 0.47530866 | 77 |
 Cincinnati |
28 | 87 | L1 | 0.46296296 | 75 |
2026 National League East Standings
| TEAM | W | L | PCT | GB | STRK |
|---|---|---|---|---|---|
 Atlanta |
- | 68 | L1 | 0.5802469 | 94 |
 Philadelphia |
6 | 74 | W1 | 0.54320985 | 88 |
 Miami |
14 | 82 | W1 | 0.49382716 | 80 |
| Washington |
17 | 85 | W1 | 0.47530866 | 77 |
 New York |
20 | 88 | L1 | 0.45679012 | 74 |