
Detroit Tigers at San Francisco Giants
· Major League Baseball
8 - 0

Jackson Jobe has sparkling debut to help the Tigers rout the Giants 8-0

Jobe (1-0) had been sidelined after Tommy John surgery in 2025. The right-hander struck out four and walked one. Willy Adames’ one-out single in the fourth was the only hit Jobe allowed.
Relievers Tyler Holton and Ty Madden combined on the two-hitter. San Francisco did not get a runner past first base.
Jobe’s most recent big-league appearance came May 28, 2025, when he started against the Giants in a 4-3 Tigers win in Detroit.
On Saturday, it was a 0-0 game through five innings. In the sixth, Giants starter Landen Roupp (7-11) walked the bases loaded. With one out, reliever Keaton Winn walked Spencer Torkelson to force home a run.
Detroit put up the six-spot in the seventh. The Tigers got to Trent Harris for three runs. Making his major-league debut, Harris allowed a double to Zach McKinstry and an RBI single by Kevin McGonigle before retiring Gleyber Torres on a grounder to second.
Dillon Dingler followed with a double down the left-field line to bring home McGonigle to make it 3-0. That was Dingler’s 80th RBI of the season.
Lefty Reiver Sanmartin then replaced Harris. The Tigers tagged Sanmartin for four hits in the inning, including a two-run double by pinch-hitter Eduardo Valencia, an RBI triple by Max Clark and a run-scoring single by Javier Baez that upped Detroit’s lead to 7-0.
Roupp allowed one run on two hits in 5-1/3 innings. He walked five and struck out three.
How can I watch Detroit Tigers vs. San Francisco Giants?
- TV Channel: Tigers at Giants 2022 MLB Baseball, is broadcasted on MLB.TV.
- Online streaming: Sign up for Fubo.
Scoring Summary
 |
9th Inning | Furman grounded out to second. |
|
9th Inning | Eldridge grounded out to first. |
|
9th Inning | Koss grounded out to shortstop. |
 |
9th Inning | McKinstry at shortstop. |
|
9th Inning | Lee at second base. |
|
9th Inning | Malgeri in left field. |
Statistics
 DET |
 SF |
|
|---|---|---|
| 1 | Games Played | 1 |
| 1 | Team Games Played | 1 |
| 0 | Hit By Pitch | 0 |
| 14 | Ground Balls | 12 |
| 5 | Strikeouts | 7 |
| 8 | Runs Batted In | 0 |
| 0 | Sacrifice Hit | 0 |
| 10 | Hits | 2 |
| 0 | Stolen Bases | 0 |
| 9 | Walks | 1 |
| 0 | Catcher Interference | 0 |
| 8 | Runs | 0 |
| 0 | Ground Into Double Play | 1 |
| 0 | Sacrifice Flies | 0 |
| 37 | At Bats | 28 |
| 0 | Home Runs | 0 |
| 0 | Grand Slam Home Runs | 0 |
| 24 | Runners Left On Base | 4 |
| 1 | Triples | 0 |
| 1 | Game Winning RBIs | 0 |
| 0 | Intentional Walks | 0 |
| 3 | Doubles | 0 |
| 18 | Fly Balls | 9 |
| 0 | Caught Stealing | 0 |
| 177 | Pitches | 124 |
| 0 | Games Started | 0 |
| 1 | Pinch At Bats | 1 |
| 1 | Pinch Hits | 0 |
| 0.0 | Player Rating | 0.0 |
| 1 | Is Qualified | 1 |
| 0 | Is Qualified In Steals | 0 |
| 15 | Total Bases | 2 |
| 46 | Plate Appearances | 29 |
| 0.0 | Projected Home Runs | 0.0 |
| 4 | Extra Base Hits | 0 |
| 7.1 | Runs Created | -1.7 |
| .270 | Batting Average | .071 |
| 1.000 | Pinch Hit Average | .000 |
| .405 | Slugging Percentage | .071 |
| .378 | Secondary Average | .036 |
| .413 | On Base Percentage | .103 |
| .818 | OBP Pct + SLG Pct | .175 |
| 0.8 | Ground To Fly Ball Ratio | 1.3 |
| 7.1 | Runs Created Per 27 Outs | -1.7 |
| 50.5 | Batter Rating | 2.0 |
| 0.0 | At Bats Per Home Run | 0.0 |
| 0.00 | Stolen Base Percentage | 0.00 |
| 3.85 | Pitches Per Plate Appearance | 4.28 |
| .135 | Isolated Power | .000 |
| 1.80 | Walk To Strikeout Ratio | 0.14 |
| .196 | Walks Per Plate Appearance | .034 |
| .108 | Secondary Average Minus Batting Average | -.036 |
| 16.0 | Runs Produced | 0.0 |
| 1.0 | Runs Ratio | 0.0 |
| 0.5 | Patience Ratio | 0.1 |
| 0.3 | Balls In Play Average | 0.1 |
| 94.3 | MLB Rating | 55.0 |
| 0.0 | Offensive Wins Above Replacement | 0.0 |
| 0.0 | Wins Above Replacement | 0.0 |
Game Information
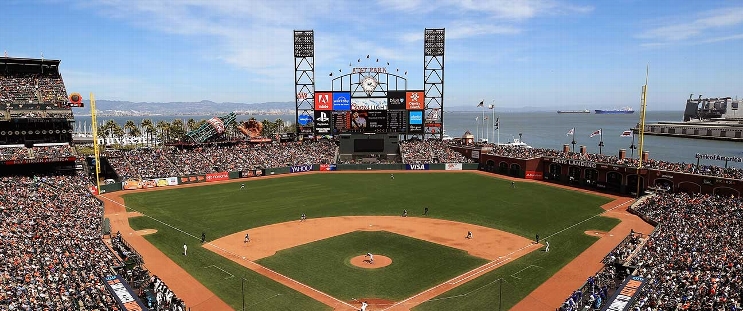
Location: San Francisco, California
Attendance: 35,506 | Capacity:
2026 American League Central Standings
| TEAM | W | L | PCT | GB | STRK |
|---|---|---|---|---|---|
 Cleveland |
- | 77 | L1 | 0.52469134 | 85 |
 Chicago |
1 | 78 | W1 | 0.5185185 | 84 |
 Minnesota |
8 | 85 | W1 | 0.47530866 | 77 |
| Detroit |
9 | 86 | L1 | 0.4691358 | 76 |
 Kansas City |
16 | 93 | W1 | 0.42592594 | 69 |
2026 National League West Standings
| TEAM | W | L | PCT | GB | STRK |
|---|---|---|---|---|---|
 Los Angeles |
- | 62 | W3 | 0.61728394 | 100 |
 San Diego |
9 | 71 | W2 | 0.5617284 | 91 |
 Arizona |
14 | 76 | L2 | 0.5308642 | 86 |
| San Francisco |
35 | 97 | L5 | 0.40123457 | 65 |
 Colorado |
42 | 104 | L1 | 0.3580247 | 58 |