
New York Mets at Pittsburgh Pirates
· Major League Baseball
0 - 9

Chandler cruises through 6 innings as Pirates beat Mets 9-0 to end 4-game skid

Chandler (5-8) struck out five and walked one on 85 pitches — 58 for strikes. The 23-year-old former top prospect has surrendered seven earned runs in 26 2/3 innings over his past five starts.
Mangum had two doubles, a single and a stolen base. Nick Gonzales drove in three runs for the Pirates, who hadn’t scored more than four in seven straight games since an 8-7 loss at the Reds on July 31.
Robert Stock (0-2) lasted three innings for the Mets, being charged for eight runs on nine hits and five walks with four strikeouts.
Mangum led off the first with a double off the right-field wall and scored from third when Gonzales grounded back to Stock with the bases loaded. Ronny Simon then slipped a two-out double just inside third base and down the line, tacking on two more.
In the third, Simon reached on a well-placed bunt, stole second and scored on a bloop single to right from Jacob Gonzalez.
Pittsburgh added four runs before recording an out in the fourth. Mangum lined an RBI double to left and scored on a wild pitch with the bases loaded. Stock walked Spencer Horwitz to reload the bases and was pulled after Gonzales lined a two-run double into the right-field corner.
Mets catcher Luis Torrens pitched the final two innings and was welcomed by Brandon Lowe sending a 42-mph pitch 380 feet to right for his 25th homer.
How can I watch New York Mets vs. Pittsburgh Pirates?
- TV Channel: Mets at Pirates 2022 MLB Baseball, is broadcasted on MLB.TV.
- Online streaming: Sign up for Fubo.
Scoring Summary
 |
9th Inning | Pache grounded out to second. |
|
9th Inning | Arias lined out to first. |
|
9th Inning | Ewing fouled out to third. |
 |
9th Inning | Yates relieved Bachar |
|
8th Inning | Davis lined out to third. |
|
8th Inning | Gonzalez grounded into double play, second to shortstop to first, Valdez out at second. |
Statistics
 NYM |
 PIT |
|
|---|---|---|
| 1 | Games Played | 1 |
| 1 | Team Games Played | 1 |
| 0 | Hit By Pitch | 1 |
| 8 | Ground Balls | 11 |
| 9 | Strikeouts | 8 |
| 0 | Runs Batted In | 8 |
| 0 | Sacrifice Hit | 0 |
| 3 | Hits | 12 |
| 0 | Stolen Bases | 2 |
| 1 | Walks | 9 |
| 0 | Catcher Interference | 0 |
| 0 | Runs | 9 |
| 0 | Ground Into Double Play | 1 |
| 0 | Sacrifice Flies | 0 |
| 29 | At Bats | 35 |
| 0 | Home Runs | 1 |
| 0 | Grand Slam Home Runs | 0 |
| 6 | Runners Left On Base | 27 |
| 0 | Triples | 0 |
| 0 | Game Winning RBIs | 1 |
| 0 | Intentional Walks | 0 |
| 0 | Doubles | 4 |
| 12 | Fly Balls | 16 |
| 1 | Caught Stealing | 1 |
| 131 | Pitches | 150 |
| 0 | Games Started | 0 |
| 0 | Pinch At Bats | 0 |
| 0 | Pinch Hits | 0 |
| 0.0 | Player Rating | 0.0 |
| 1 | Is Qualified | 1 |
| 1 | Is Qualified In Steals | 1 |
| 3 | Total Bases | 19 |
| 30 | Plate Appearances | 45 |
| 0.0 | Projected Home Runs | 162.0 |
| 0 | Extra Base Hits | 5 |
| -1.2 | Runs Created | 9.3 |
| .103 | Batting Average | .343 |
| .000 | Pinch Hit Average | .000 |
| .103 | Slugging Percentage | .543 |
| .000 | Secondary Average | .486 |
| .133 | On Base Percentage | .489 |
| .237 | OBP Pct + SLG Pct | 1.032 |
| 0.7 | Ground To Fly Ball Ratio | 0.7 |
| -1.2 | Runs Created Per 27 Outs | 10.1 |
| 3.0 | Batter Rating | 59.0 |
| 0.0 | At Bats Per Home Run | 35.0 |
| 0.00 | Stolen Base Percentage | 0.67 |
| 4.37 | Pitches Per Plate Appearance | 3.33 |
| .000 | Isolated Power | .200 |
| 0.11 | Walk To Strikeout Ratio | 1.13 |
| .033 | Walks Per Plate Appearance | .200 |
| -.103 | Secondary Average Minus Batting Average | .143 |
| 0.0 | Runs Produced | 17.0 |
| 0.0 | Runs Ratio | 0.9 |
| 0.1 | Patience Ratio | 0.7 |
| 0.2 | Balls In Play Average | 0.4 |
| 56.3 | MLB Rating | 102.0 |
| 0.0 | Offensive Wins Above Replacement | 0.0 |
| 0.0 | Wins Above Replacement | 0.0 |
Game Information
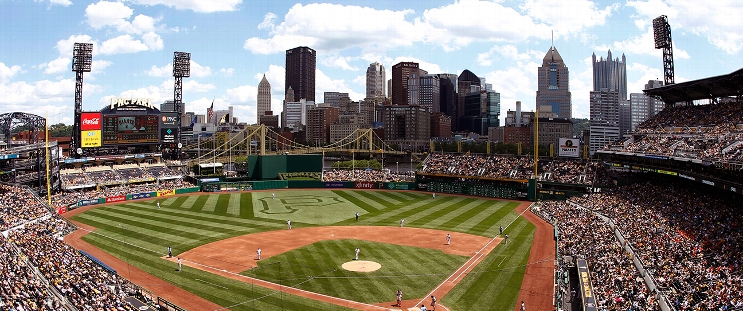
Location: Pittsburgh, Pennsylvania
Attendance: 30,121 | Capacity:
2026 National League East Standings
| TEAM | W | L | PCT | GB | STRK |
|---|---|---|---|---|---|
 Atlanta |
- | 68 | L1 | 0.5802469 | 94 |
 Philadelphia |
6 | 74 | W1 | 0.54320985 | 88 |
 Miami |
14 | 82 | W1 | 0.49382716 | 80 |
 Washington |
17 | 85 | W1 | 0.47530866 | 77 |
| New York |
20 | 88 | L1 | 0.45679012 | 74 |
2026 National League Central Standings
| TEAM | W | L | PCT | GB | STRK |
|---|---|---|---|---|---|
 Milwaukee |
- | 59 | W5 | 0.63580245 | 103 |
 Chicago |
14 | 73 | W1 | 0.5493827 | 89 |
| Pittsburgh |
21 | 80 | W1 | 0.50617284 | 82 |
 St. Louis |
26 | 85 | L4 | 0.47530866 | 77 |
 Cincinnati |
28 | 87 | L1 | 0.46296296 | 75 |