
San Francisco Giants at Texas Rangers
· Major League Baseball
0 - 6

Cody Bradford pitches 4 1/3 effective innings in first outing since 2024 as Rangers blank Giants 6-0

Bradford worked around traffic in all but the third inning of his first outing in 679 days following elbow surgery in June 2025. The left-hander allowed five hits and two walks, throwing 70 pitches.
Reliever Tyler Alexander (2-2) got the final two outs of the fifth, leaving two runners on. Alexander struck out three in 1 2/3 innings.
The Rangers (57-58) won the last two games after dropping Monday’s series opener, their season-worst sixth straight loss. The AL West leaders by two games on July 28, they trail first-place Houston by 1 1/2 games.
The Giants (48-67) fell 19 games under .500 for the first time this season, having lost seven consecutive road series. They left 11 men on base, going 0 for 8 with runners in scoring position.
Bradford was 10-6 with a 4.28 ERA from 2023-24 and made five postseason relief appearances in Texas’ run to the 2023 World Series title.
Five of the first six batters who faced Giants left-hander Carson Whisenhunt (2-3) a second time reached base, including Foscue’s first career triple and doubles by Wyatt Langford and Elias Díaz.
Brandon Nimmo drove in two runs, including a homer sliced down the left field line in the fifth off Carson Seymour.
Whisenhunt has allowed 14 earned runs in 11 2/3 innings in his last three starts.
It was Texas’ 10th shutout this season. San Francisco was shut out for the 11th time.
How can I watch San Francisco Giants vs. Texas Rangers?
- TV Channel: Giants at Rangers 2022 MLB Baseball, is broadcasted on ESPN Unlmtd.
- Online streaming: Sign up for Fubo.
Scoring Summary
 |
9th Inning | Lee grounded out to pitcher. |
|
9th Inning | Eldridge grounded out to second, Cavanaugh to third. |
|
9th Inning | Cavanaugh doubled to center. |
|
9th Inning | Gilbert fouled out to catcher. |
 |
9th Inning | Winn relieved Silseth |
|
9th Inning | Gilbert hit for Leonard |
Statistics
 SF |
 TEX |
|
|---|---|---|
| 1 | Games Played | 1 |
| 1 | Team Games Played | 1 |
| 0 | Hit By Pitch | 0 |
| 8 | Ground Balls | 10 |
| 10 | Strikeouts | 8 |
| 0 | Runs Batted In | 6 |
| 0 | Sacrifice Hit | 0 |
| 8 | Hits | 9 |
| 0 | Stolen Bases | 0 |
| 3 | Walks | 5 |
| 0 | Catcher Interference | 0 |
| 0 | Runs | 6 |
| 0 | Ground Into Double Play | 1 |
| 0 | Sacrifice Flies | 0 |
| 35 | At Bats | 31 |
| 0 | Home Runs | 1 |
| 0 | Grand Slam Home Runs | 0 |
| 17 | Runners Left On Base | 15 |
| 0 | Triples | 1 |
| 0 | Game Winning RBIs | 1 |
| 0 | Intentional Walks | 0 |
| 2 | Doubles | 2 |
| 17 | Fly Balls | 13 |
| 0 | Caught Stealing | 1 |
| 138 | Pitches | 144 |
| 0 | Games Started | 0 |
| 1 | Pinch At Bats | 1 |
| 0 | Pinch Hits | 0 |
| 0.0 | Player Rating | 0.0 |
| 1 | Is Qualified | 1 |
| 0 | Is Qualified In Steals | 1 |
| 10 | Total Bases | 16 |
| 38 | Plate Appearances | 36 |
| 0.0 | Projected Home Runs | 162.0 |
| 2 | Extra Base Hits | 4 |
| 3.0 | Runs Created | 5.6 |
| .229 | Batting Average | .290 |
| .000 | Pinch Hit Average | .000 |
| .286 | Slugging Percentage | .516 |
| .143 | Secondary Average | .355 |
| .289 | On Base Percentage | .389 |
| .575 | OBP Pct + SLG Pct | .905 |
| 0.5 | Ground To Fly Ball Ratio | 0.8 |
| 3.0 | Runs Created Per 27 Outs | 6.3 |
| 12.0 | Batter Rating | 42.5 |
| 0.0 | At Bats Per Home Run | 31.0 |
| 0.00 | Stolen Base Percentage | 0.00 |
| 3.63 | Pitches Per Plate Appearance | 4.00 |
| .057 | Isolated Power | .226 |
| 0.30 | Walk To Strikeout Ratio | 0.63 |
| .079 | Walks Per Plate Appearance | .139 |
| -.086 | Secondary Average Minus Batting Average | .065 |
| 0.0 | Runs Produced | 12.0 |
| 0.0 | Runs Ratio | 1.0 |
| 0.3 | Patience Ratio | 0.6 |
| 0.3 | Balls In Play Average | 0.4 |
| 68.5 | MLB Rating | 89.5 |
| 0.0 | Offensive Wins Above Replacement | 0.0 |
| 0.0 | Wins Above Replacement | 0.0 |
Game Information
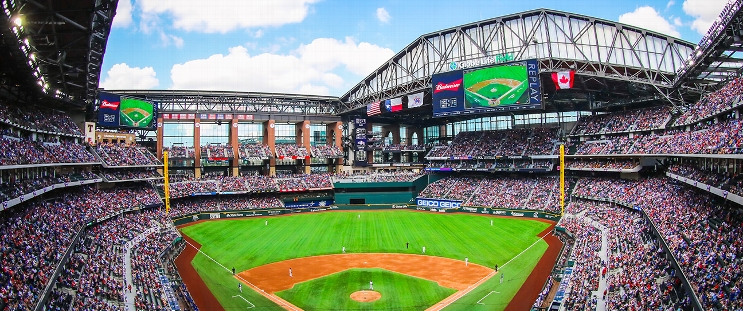
Location: Arlington, Texas
Attendance: 26,098 | Capacity:
2026 National League West Standings
| TEAM | W | L | PCT | GB | STRK |
|---|---|---|---|---|---|
 Los Angeles |
- | 62 | W3 | 0.61728394 | 100 |
 San Diego |
9 | 71 | W2 | 0.5617284 | 91 |
 Arizona |
14 | 76 | L2 | 0.5308642 | 86 |
| San Francisco |
35 | 97 | L5 | 0.40123457 | 65 |
 Colorado |
42 | 104 | L1 | 0.3580247 | 58 |
2026 American League West Standings
| TEAM | W | L | PCT | GB | STRK |
|---|---|---|---|---|---|
 Houston |
- | 81 | W2 | 0.5 | 81 |
| Texas |
1 | 82 | L1 | 0.49382716 | 80 |
 Seattle |
5 | 86 | W2 | 0.4691358 | 76 |
 Athletics |
17 | 98 | L2 | 0.39506173 | 64 |
 Los Angeles |
19 | 100 | L2 | 0.38271606 | 62 |