
New York Yankees at Chicago Cubs
· Major League Baseball
2 - 5

Pete Crow-Armstrong's go-ahead triple lifts Cubs to 5-2 win over Yankees

Nico Hoerner started the winning rally with his sixth home run, tying the score off Fernando Cruz (4-6), before Crow-Armstrong scored Pedro Ramirez with a line drive into the right-field corner off Brent Headrick. Crow-Armstrong then came home on Seiya Suzuki’s single to center.
Crow-Armstrong scored the game’s first run in the first inning by walking and advancing on a pair of wild pitches by Max Fried.
Michael Busch made it 5-2 in the eighth with an RBI single off Yovanny Cruz.
Cubs reliever Trent Thornton (4-4) pitched 2/3 of an inning for the win. Caleb Thielbar allowed one hit in the ninth but for his third save.
With the wind blowing in from center field at 21 mph, Spencer Jones homered and scored both of the Yankees' runs and Ali Sanchez had three of New York's eight hits.
Jones, on base thanks to Michael Busch's error, scored from second on Jose Caballero's single in the fifth.
In the seventh, Jones lined David Peterson's fastball to left, Jones’ fifth home run of the season and Peterson’s 97th and final pitch of the night. Peterson allowed two runs, one earned, in 6 1/3 innings, allowing five hits and striking out eight.
Fried allowed two hits and one run in 5 1/3 innings, striking out seven and walking one. Fried has allowed one run or fewer in six of his 13 starts.
How can I watch New York Yankees vs. Chicago Cubs?
- TV Channel: Yankees at Cubs 2022 MLB Baseball, is broadcasted on MLB.TV.
- Online streaming: Sign up for Fubo.
Scoring Summary
 |
9th Inning | Caballero grounded out to second. |
|
9th Inning | Sánchez grounded into double play, shortstop to second to first, Jones out at second. |
|
9th Inning | Jones singled to right. |
 |
9th Inning | Thielbar relieved Webb |
|
8th Inning | Happ grounded out to shortstop. |
|
8th Inning | Hoerner grounded into double play, shortstop to second to first, Busch out at second, C. Kelly to third. |
Statistics
 NYY |
 CHC |
|
|---|---|---|
| 1 | Games Played | 1 |
| 1 | Team Games Played | 1 |
| 0 | Hit By Pitch | 0 |
| 16 | Ground Balls | 8 |
| 9 | Strikeouts | 7 |
| 2 | Runs Batted In | 4 |
| 0 | Sacrifice Hit | 0 |
| 8 | Hits | 7 |
| 2 | Stolen Bases | 0 |
| 2 | Walks | 5 |
| 0 | Catcher Interference | 0 |
| 2 | Runs | 5 |
| 1 | Ground Into Double Play | 1 |
| 0 | Sacrifice Flies | 0 |
| 34 | At Bats | 29 |
| 1 | Home Runs | 1 |
| 0 | Grand Slam Home Runs | 0 |
| 11 | Runners Left On Base | 13 |
| 0 | Triples | 1 |
| 0 | Game Winning RBIs | 1 |
| 0 | Intentional Walks | 0 |
| 1 | Doubles | 0 |
| 9 | Fly Balls | 14 |
| 1 | Caught Stealing | 0 |
| 144 | Pitches | 142 |
| 0 | Games Started | 0 |
| 1 | Pinch At Bats | 0 |
| 0 | Pinch Hits | 0 |
| 0.0 | Player Rating | 0.0 |
| 1 | Is Qualified | 1 |
| 1 | Is Qualified In Steals | 0 |
| 12 | Total Bases | 12 |
| 36 | Plate Appearances | 34 |
| 162.0 | Projected Home Runs | 162.0 |
| 2 | Extra Base Hits | 2 |
| 3.0 | Runs Created | 4.2 |
| .235 | Batting Average | .241 |
| .000 | Pinch Hit Average | .000 |
| .353 | Slugging Percentage | .414 |
| .206 | Secondary Average | .345 |
| .278 | On Base Percentage | .353 |
| .631 | OBP Pct + SLG Pct | .767 |
| 1.8 | Ground To Fly Ball Ratio | 0.6 |
| 2.9 | Runs Created Per 27 Outs | 5.0 |
| 23.0 | Batter Rating | 30.5 |
| 34.0 | At Bats Per Home Run | 29.0 |
| 0.67 | Stolen Base Percentage | 0.00 |
| 4.00 | Pitches Per Plate Appearance | 4.18 |
| .118 | Isolated Power | .172 |
| 0.22 | Walk To Strikeout Ratio | 0.71 |
| .056 | Walks Per Plate Appearance | .147 |
| -.029 | Secondary Average Minus Batting Average | .103 |
| 4.0 | Runs Produced | 9.0 |
| 1.0 | Runs Ratio | 0.8 |
| 0.4 | Patience Ratio | 0.5 |
| 0.3 | Balls In Play Average | 0.3 |
| 75.0 | MLB Rating | 81.0 |
| 0.0 | Offensive Wins Above Replacement | 0.0 |
| 0.0 | Wins Above Replacement | 0.0 |
Game Information
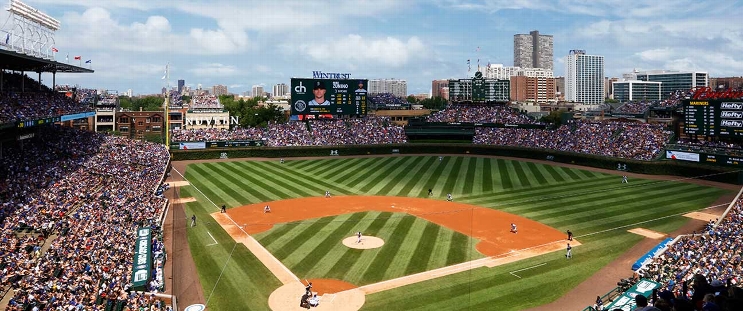
Location: Chicago, Illinois
Attendance: 39,630 | Capacity:
2026 American League East Standings
| TEAM | W | L | PCT | GB | STRK |
|---|---|---|---|---|---|
 Tampa Bay |
- | 64 | L1 | 0.60493827 | 98 |
| New York |
4.5 | 68 | W1 | 0.57763976 | 93 |
 Boston |
11 | 75 | L1 | 0.537037 | 87 |
 Baltimore |
18.5 | 82 | L1 | 0.49068323 | 79 |
 Toronto |
19 | 83 | W1 | 0.48765433 | 79 |
2026 National League Central Standings
| TEAM | W | L | PCT | GB | STRK |
|---|---|---|---|---|---|
 Milwaukee |
- | 59 | W5 | 0.63580245 | 103 |
| Chicago |
14 | 73 | W1 | 0.5493827 | 89 |
 Pittsburgh |
21 | 80 | W1 | 0.50617284 | 82 |
 St. Louis |
26 | 85 | L4 | 0.47530866 | 77 |
 Cincinnati |
28 | 87 | L1 | 0.46296296 | 75 |