
Milwaukee Brewers at San Francisco Giants
· Major League Baseball
8 - 2

Brice Turang paces Brewers offense in 8-2 win over Giants

Brewers rookie Luis Lara knocked in three runs and Jackson Chourio added two hits and two RBI to help the NL Central leaders end a four-game road skid. Henderson had seven strikeouts and allowed two hits in 5 2/3 scoreless innings to win his first career start against San Francisco.
Bryce Eldridge hit his 11th home run for the Giants, a two-run shot that made it 8-2 in the eighth.
One of San Francisco’s seven hits came when Heliot Ramos’ high popup in the first fell between a pair of Milwaukee infielders.
Henderson (5-1) was sharp all night. The 24-year-old right-hander walked two and didn’t allow a run for the second time this season in a start of five innings or longer.
Four relievers combined to get the final 10 outs for Milwaukee.
All nine Brewers starters had at least one hit as they finished with 13. Milwaukee had runners on base in eight innings.
Chourio put Milwaukee ahead early with an RBI single off starter Landen Roupp in the third.
Cooper Pratt had an RBI single in the fourth and Turang added a two-run single to make it 4-0.
The Brewers got another run in the fifth when William Contreras tripled off the brick wall in right field and scored on Lara’s groundout. Lara added a two-run triple in the seventh to extend the lead to 7-0.
Roupp (7-9) allowed four runs and four hits in 3 2/3 innings.
Before the game, the Giants Casey Schmitt on the 10-day injured list with a torn meniscus in his left knee.
How can I watch Milwaukee Brewers vs. San Francisco Giants?
- TV Channel: Brewers at Giants 2022 MLB Baseball, is broadcasted on MLB.TV.
- Online streaming: Sign up for Fubo.
Scoring Summary
 |
9th Inning | Cavanaugh grounded into double play, second to shortstop to first, McCray out at second. |
|
9th Inning | McCray reached on infield single to third, Lee to second. |
|
9th Inning | Adames popped out to shortstop. |
|
9th Inning | Lee singled to right. |
 |
9th Inning | Uribe relieved Anderson |
|
9th Inning | Pratt grounded into double play, third to second to first, Mitchell out at second. |
Statistics
 MIL |
 SF |
|
|---|---|---|
| 1 | Games Played | 1 |
| 1 | Team Games Played | 1 |
| 2 | Hit By Pitch | 0 |
| 22 | Ground Balls | 13 |
| 3 | Strikeouts | 9 |
| 8 | Runs Batted In | 2 |
| 1 | Sacrifice Hit | 0 |
| 13 | Hits | 7 |
| 2 | Stolen Bases | 0 |
| 5 | Walks | 2 |
| 0 | Catcher Interference | 0 |
| 8 | Runs | 2 |
| 2 | Ground Into Double Play | 2 |
| 0 | Sacrifice Flies | 0 |
| 36 | At Bats | 33 |
| 0 | Home Runs | 1 |
| 0 | Grand Slam Home Runs | 0 |
| 19 | Runners Left On Base | 12 |
| 2 | Triples | 0 |
| 1 | Game Winning RBIs | 0 |
| 0 | Intentional Walks | 0 |
| 1 | Doubles | 0 |
| 12 | Fly Balls | 11 |
| 1 | Caught Stealing | 0 |
| 191 | Pitches | 157 |
| 0 | Games Started | 0 |
| 0 | Pinch At Bats | 0 |
| 0 | Pinch Hits | 0 |
| 0.0 | Player Rating | 0.0 |
| 1 | Is Qualified | 1 |
| 1 | Is Qualified In Steals | 0 |
| 18 | Total Bases | 10 |
| 44 | Plate Appearances | 35 |
| 0.0 | Projected Home Runs | 162.0 |
| 3 | Extra Base Hits | 1 |
| 7.9 | Runs Created | 1.8 |
| .361 | Batting Average | .212 |
| .000 | Pinch Hit Average | .000 |
| .500 | Slugging Percentage | .303 |
| .306 | Secondary Average | .152 |
| .465 | On Base Percentage | .257 |
| .965 | OBP Pct + SLG Pct | .560 |
| 1.8 | Ground To Fly Ball Ratio | 1.2 |
| 7.9 | Runs Created Per 27 Outs | 1.7 |
| 54.0 | Batter Rating | 18.0 |
| 0.0 | At Bats Per Home Run | 33.0 |
| 0.67 | Stolen Base Percentage | 0.00 |
| 4.34 | Pitches Per Plate Appearance | 4.49 |
| .139 | Isolated Power | .091 |
| 1.67 | Walk To Strikeout Ratio | 0.22 |
| .114 | Walks Per Plate Appearance | .057 |
| -.056 | Secondary Average Minus Batting Average | -.061 |
| 16.0 | Runs Produced | 4.0 |
| 1.0 | Runs Ratio | 1.0 |
| 0.6 | Patience Ratio | 0.3 |
| 0.4 | Balls In Play Average | 0.3 |
| 101.8 | MLB Rating | 71.8 |
| 0.0 | Offensive Wins Above Replacement | 0.0 |
| 0.0 | Wins Above Replacement | 0.0 |
Game Information
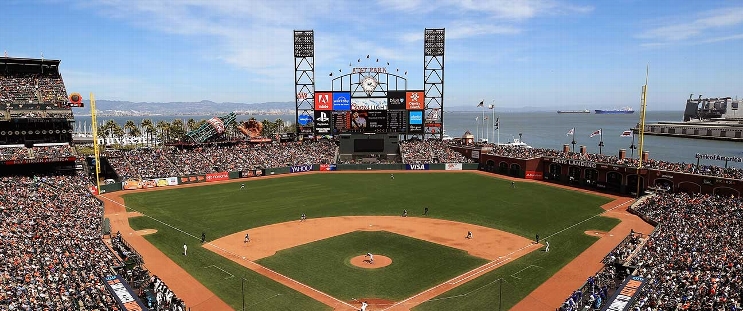
Location: San Francisco, California
Attendance: 38,021 | Capacity:
2026 National League Central Standings
| TEAM | W | L | PCT | GB | STRK |
|---|---|---|---|---|---|
| Milwaukee |
- | 59 | W5 | 0.63580245 | 103 |
 Chicago |
14 | 73 | W1 | 0.5493827 | 89 |
 Pittsburgh |
21 | 80 | W1 | 0.50617284 | 82 |
 St. Louis |
26 | 85 | L4 | 0.47530866 | 77 |
 Cincinnati |
28 | 87 | L1 | 0.46296296 | 75 |
2026 National League West Standings
| TEAM | W | L | PCT | GB | STRK |
|---|---|---|---|---|---|
 Los Angeles |
- | 62 | W3 | 0.61728394 | 100 |
 San Diego |
9 | 71 | W2 | 0.5617284 | 91 |
 Arizona |
14 | 76 | L2 | 0.5308642 | 86 |
| San Francisco |
35 | 97 | L5 | 0.40123457 | 65 |
 Colorado |
42 | 104 | L1 | 0.3580247 | 58 |