
Toronto Blue Jays at Washington Nationals
· Major League Baseball
6 - 8

Nationals draw 6 walks against Shane Bieber in 4-run first inning, beat Blue Jays 8-6

Luis García Jr. and Dylan Crews hit back-to-back home runs in the fourth for Washington, which is a game behind Arizona in the race for the National League's third wild-card spot.
Kazuma Okamoto hit his 24th homer to tie a franchise rookie record for the Blue Jays, who have lost 10 of 14 and slipped 10 games under .500, matching a season high.
Bieber (2-2) became the 11th pitcher in major league history to walk at least six batters while recording two or fewer outs, and the first since Florida’s Ryan Dempster on Oct. 5, 2001, at Atlanta. He threw 42 pitches, just 15 for strikes.
After allowing two walks and an infield single to load the bases, Bieber issued back-to-back run-scoring walks to Keibert Ruiz and Daylen Lile. After Nasim Nuñez’s sacrifice fly, Jorbit Vivas drew the inning’s fifth pass. Jacob Young then walked to make it 4-0 and end Bieber’s night.
The Nationals’ six walks were their most in an inning since moving to Washington before the 2005 season.
The start of the game was delayed 67 minutes by rain.
Washington starter Cade Cavalli (8-4) allowed three runs (two earned) and struck out three in six innings. He is 3-0 with a 2.25 ERA in his last four starts. Clayton Beeter pitched a 1-2-3 ninth for his 11th save.
Toronto first baseman Vladimir Guerrero Jr. left in the fourth inning due to right hamstring tightness. Okamoto replaced him and went deep in the fifth to tie Eric Hinske’s 2002 club rookie mark.
George Springer hit a three-run blast in the eighth off Gus Varland to pull the Blue Jays within 8-6.
How can I watch Toronto Blue Jays vs. Washington Nationals?
- TV Channel: Blue Jays at Nationals 2022 MLB Baseball, is broadcasted on MLB.TV.
- Online streaming: Sign up for Fubo.
Scoring Summary
 |
9th Inning | Straw lined out to second. |
|
9th Inning | Urías struck out swinging. |
|
9th Inning | Giménez grounded out to first. |
 |
9th Inning | Beeter relieved Ribalta |
|
8th Inning | Ruiz struck out swinging. |
|
8th Inning | Abrams flied out to right. |
Statistics
 TOR |
 WSH |
|
|---|---|---|
| 1 | Games Played | 1 |
| 1 | Team Games Played | 1 |
| 0 | Hit By Pitch | 0 |
| 17 | Ground Balls | 12 |
| 6 | Strikeouts | 7 |
| 5 | Runs Batted In | 8 |
| 0 | Sacrifice Hit | 0 |
| 8 | Hits | 8 |
| 0 | Stolen Bases | 0 |
| 2 | Walks | 8 |
| 0 | Catcher Interference | 0 |
| 6 | Runs | 8 |
| 1 | Ground Into Double Play | 0 |
| 0 | Sacrifice Flies | 2 |
| 35 | At Bats | 31 |
| 2 | Home Runs | 2 |
| 0 | Grand Slam Home Runs | 0 |
| 12 | Runners Left On Base | 16 |
| 0 | Triples | 0 |
| 0 | Game Winning RBIs | 1 |
| 0 | Intentional Walks | 0 |
| 1 | Doubles | 0 |
| 12 | Fly Balls | 14 |
| 0 | Caught Stealing | 1 |
| 153 | Pitches | 173 |
| 0 | Games Started | 0 |
| 1 | Pinch At Bats | 1 |
| 0 | Pinch Hits | 0 |
| 0.0 | Player Rating | 0.0 |
| 1 | Is Qualified | 1 |
| 0 | Is Qualified In Steals | 1 |
| 15 | Total Bases | 14 |
| 37 | Plate Appearances | 41 |
| 324.0 | Projected Home Runs | 324.0 |
| 3 | Extra Base Hits | 2 |
| 3.8 | Runs Created | 6.1 |
| .229 | Batting Average | .258 |
| .000 | Pinch Hit Average | .000 |
| .429 | Slugging Percentage | .452 |
| .257 | Secondary Average | .419 |
| .270 | On Base Percentage | .390 |
| .699 | OBP Pct + SLG Pct | .842 |
| 1.4 | Ground To Fly Ball Ratio | 0.9 |
| 3.7 | Runs Created Per 27 Outs | 6.3 |
| 38.0 | Batter Rating | 46.0 |
| 17.5 | At Bats Per Home Run | 15.5 |
| 0.00 | Stolen Base Percentage | 0.00 |
| 4.14 | Pitches Per Plate Appearance | 4.22 |
| .200 | Isolated Power | .194 |
| 0.33 | Walk To Strikeout Ratio | 1.14 |
| .054 | Walks Per Plate Appearance | .195 |
| .029 | Secondary Average Minus Batting Average | .161 |
| 11.0 | Runs Produced | 16.0 |
| 0.8 | Runs Ratio | 1.0 |
| 0.5 | Patience Ratio | 0.6 |
| 0.2 | Balls In Play Average | 0.3 |
| 85.3 | MLB Rating | 91.8 |
| 0.0 | Offensive Wins Above Replacement | 0.0 |
| 0.0 | Wins Above Replacement | 0.0 |
Game Information
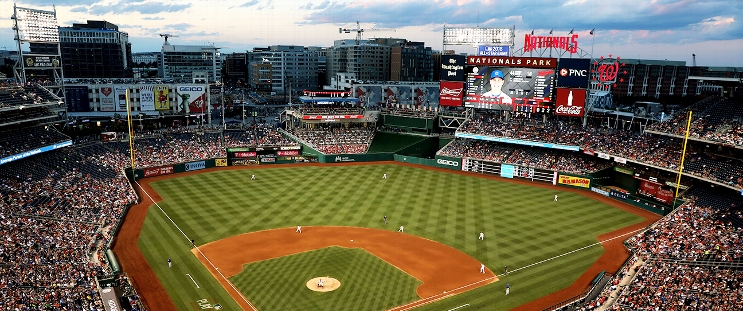
Location: Washington, District of Columbia
Attendance: 20,775 | Capacity:
2026 American League East Standings
| TEAM | W | L | PCT | GB | STRK |
|---|---|---|---|---|---|
 Tampa Bay |
- | 64 | L1 | 0.60493827 | 98 |
 New York |
4.5 | 68 | W1 | 0.57763976 | 93 |
 Boston |
11 | 75 | L1 | 0.537037 | 87 |
 Baltimore |
18.5 | 82 | L1 | 0.49068323 | 79 |
| Toronto |
19 | 83 | W1 | 0.48765433 | 79 |
2026 National League East Standings
| TEAM | W | L | PCT | GB | STRK |
|---|---|---|---|---|---|
 Atlanta |
- | 68 | L1 | 0.5802469 | 94 |
 Philadelphia |
6 | 74 | W1 | 0.54320985 | 88 |
 Miami |
14 | 82 | W1 | 0.49382716 | 80 |
| Washington |
17 | 85 | W1 | 0.47530866 | 77 |
 New York |
20 | 88 | L1 | 0.45679012 | 74 |