
Arizona Diamondbacks at Pittsburgh Pirates
· Major League Baseball
8 - 7

James McCann's 12th-inning single gives Diamondbacks 8-7 win over Pirates after blowing six-run lead

Brandon Lowe and Bryan Reynolds hit back-to-back home runs for the Pirates to spark a three-run rally against closer Paul Sewald in the ninth to tie the game at 6-all and force extra innings. Lowe's two-run shot was his team-leading 22nd of the season.
It was Sewald’s third blown save in 27 opportunities.
The Pirates also had a three-run eighth to make it 6-3 on RBI singles by Ryan O’Hearn, Endy Rodríguez and Marcell Ozuna.
Both teams scored runs in the 10th on errors.
Geraldo Carillo (1-0) got his first major league win as the Diamondbacks won for the 11th time in 17 games. McCann’s winning hit came off Wilbur Dotel (1-3).
The Diamondbacks’ Brandon Pfaadt pitched seven scoreless innings, left with a 6-0 lead, and was in line to win his career-high sixth consecutive start since returning from Triple-A Reno on June 30. However, the bullpen blew the lead.
Pfaadt gave up six hits, struck out four and walked one. He was a 13-game winner last year but was sent to the minor leagues on June 4 after struggling.
Pirates rookie Bubba Chandler struggled to get through four innings. Four of the five runs Chandler allowed were earned, and he surrendered eight hits as he put the Pirates in a five-run hole.
The Pirates had 14 hits, including two each from Jake Mangum, Lowe, O’Hearn, Nick Gonzales and Ozuna.
How can I watch Arizona Diamondbacks vs. Pittsburgh Pirates?
- TV Channel: Diamondbacks at Pirates 2022 MLB Baseball, is broadcasted on MLB.TV.
- Online streaming: Sign up for Fubo.
Scoring Summary
 |
12th Inning | Callihan struck out swinging. |
|
12th Inning | Rodríguez struck out swinging. |
|
12th Inning | Gonzales grounded out to third. |
|
12th Inning | Cook ran for O'Hearn |
 |
12th Inning | Perdomo grounded out to first. |
|
12th Inning | Carroll stole second. |
Statistics
 ARI |
 PIT |
|
|---|---|---|
| 1 | Games Played | 1 |
| 1 | Team Games Played | 1 |
| 1 | Hit By Pitch | 0 |
| 26 | Ground Balls | 13 |
| 11 | Strikeouts | 10 |
| 6 | Runs Batted In | 6 |
| 2 | Sacrifice Hit | 1 |
| 15 | Hits | 14 |
| 1 | Stolen Bases | 1 |
| 3 | Walks | 3 |
| 0 | Catcher Interference | 0 |
| 8 | Runs | 7 |
| 3 | Ground Into Double Play | 1 |
| 0 | Sacrifice Flies | 0 |
| 50 | At Bats | 49 |
| 0 | Home Runs | 2 |
| 0 | Grand Slam Home Runs | 0 |
| 43 | Runners Left On Base | 25 |
| 1 | Triples | 0 |
| 1 | Game Winning RBIs | 0 |
| 1 | Intentional Walks | 1 |
| 4 | Doubles | 5 |
| 15 | Fly Balls | 27 |
| 0 | Caught Stealing | 0 |
| 224 | Pitches | 187 |
| 0 | Games Started | 0 |
| 0 | Pinch At Bats | 1 |
| 0 | Pinch Hits | 0 |
| 0.0 | Player Rating | 0.0 |
| 1 | Is Qualified | 1 |
| 1 | Is Qualified In Steals | 1 |
| 21 | Total Bases | 25 |
| 56 | Plate Appearances | 53 |
| 0.0 | Projected Home Runs | 324.0 |
| 5 | Extra Base Hits | 7 |
| 6.7 | Runs Created | 8.0 |
| .300 | Batting Average | .286 |
| .000 | Pinch Hit Average | .000 |
| .420 | Slugging Percentage | .510 |
| .200 | Secondary Average | .306 |
| .352 | On Base Percentage | .327 |
| .772 | OBP Pct + SLG Pct | .837 |
| 1.7 | Ground To Fly Ball Ratio | 0.5 |
| 4.5 | Runs Created Per 27 Outs | 5.9 |
| 54.5 | Batter Rating | 57.0 |
| 0.0 | At Bats Per Home Run | 24.5 |
| 1.00 | Stolen Base Percentage | 1.00 |
| 4.00 | Pitches Per Plate Appearance | 3.53 |
| .120 | Isolated Power | .224 |
| 0.27 | Walk To Strikeout Ratio | 0.30 |
| .054 | Walks Per Plate Appearance | .057 |
| -.100 | Secondary Average Minus Batting Average | .020 |
| 14.0 | Runs Produced | 13.0 |
| 0.8 | Runs Ratio | 0.9 |
| 0.5 | Patience Ratio | 0.6 |
| 0.4 | Balls In Play Average | 0.3 |
| 99.3 | MLB Rating | 101.0 |
| 0.0 | Offensive Wins Above Replacement | 0.0 |
| 0.0 | Wins Above Replacement | 0.0 |
Game Information
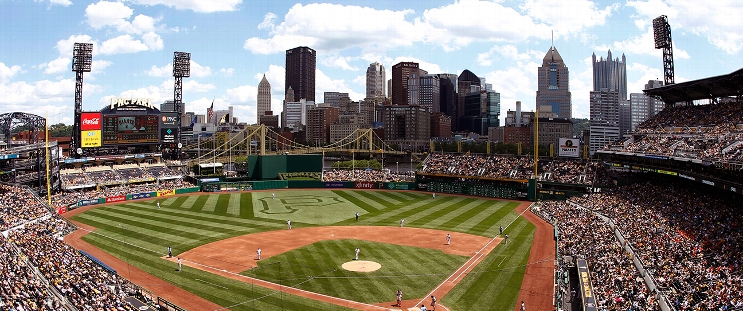
Location: Pittsburgh, Pennsylvania
Attendance: 19,024 | Capacity:
2026 National League West Standings
| TEAM | W | L | PCT | GB | STRK |
|---|---|---|---|---|---|
 Los Angeles |
- | 62 | W3 | 0.61728394 | 100 |
 San Diego |
9 | 71 | W2 | 0.5617284 | 91 |
| Arizona |
14 | 76 | L2 | 0.5308642 | 86 |
 San Francisco |
35 | 97 | L5 | 0.40123457 | 65 |
 Colorado |
42 | 104 | L1 | 0.3580247 | 58 |
2026 National League Central Standings
| TEAM | W | L | PCT | GB | STRK |
|---|---|---|---|---|---|
 Milwaukee |
- | 59 | W5 | 0.63580245 | 103 |
 Chicago |
14 | 73 | W1 | 0.5493827 | 89 |
| Pittsburgh |
21 | 80 | W1 | 0.50617284 | 82 |
 St. Louis |
26 | 85 | L4 | 0.47530866 | 77 |
 Cincinnati |
28 | 87 | L1 | 0.46296296 | 75 |