
Athletics at Minnesota Twins
· Major League Baseball
8 - 11

Jeffers drives in 3 runs and Prielipp wins in return from IL as Twins beat Athletics 11-8

Kody Clemens was 3 for 5 with two triples and an RBI, and Ryan Kreidler doubled three times and drove in a run for the Twins.
Prielipp (3-5), who had been sidelined by a blister on his middle finger, allowed two hits and one walk while striking out five.
Nick Kurtz hit a three-run homer for the Athletics in the sixth. Jeff McNeil and Carlos Cortes each drove in two runs.
Royce Lewis reached when he grounded into an run-scoring fielder's choice and stole second base before Clemens hit an RBI triple and scored on a throwing error by shortstop Alika Williams to give Minnesota a 3-0 lead in the first inning.
Alex Jackson scored from third after reliever Luis Morales balked with the bases loaded, and Jeffers followed with a two-run single that made it 6-0 in the second.
Kreidler doubled leading off the fourth, stole third base and scored on a throwing error by catcher Jonah Heim to push the lead to 7-0.
Kreidler doubled and stole third base before he scored on a sacrifice fly by Austin Martin in the sixth to make it 8-3.
Athletics starter Jeffrey Springs left the game in the second due to an apparent injury and was replaced by Morales. Springs (3-10) allowed five runs, four earned, in 1 1/3 innings.
Athletics hitting coach Chris Cron was ejected by plate umpire Chad Fairchild in the second.
After a day off, Twins RHP Taj Bradley (9-4, 3.65) pitches Tuesday against Kansas City to begin a three-game series.
How can I watch Athletics vs. Minnesota Twins?
- TV Channel: Athletics at Twins 2022 MLB Baseball, is broadcasted on MLB.TV.
- Online streaming: Sign up for Fubo.
Scoring Summary
 |
9th Inning | Wilson grounded out to first. |
|
9th Inning | Cortes to second on fielder's indifference. |
|
9th Inning | Cortes grounded into fielder's choice to second, Walton scored, McNeil out at second. |
|
9th Inning | McNeil singled to right, White scored, Walton to third. |
|
9th Inning | Walton singled to right, White to third. |
|
9th Inning | Butler flied out to center. |
Statistics
 ATH |
 MIN |
|
|---|---|---|
| 1 | Games Played | 1 |
| 1 | Team Games Played | 1 |
| 1 | Hit By Pitch | 0 |
| 10 | Ground Balls | 11 |
| 6 | Strikeouts | 6 |
| 8 | Runs Batted In | 8 |
| 0 | Sacrifice Hit | 0 |
| 8 | Hits | 13 |
| 0 | Stolen Bases | 3 |
| 3 | Walks | 2 |
| 0 | Catcher Interference | 0 |
| 8 | Runs | 11 |
| 2 | Ground Into Double Play | 0 |
| 1 | Sacrifice Flies | 2 |
| 32 | At Bats | 37 |
| 1 | Home Runs | 0 |
| 0 | Grand Slam Home Runs | 0 |
| 10 | Runners Left On Base | 19 |
| 0 | Triples | 3 |
| 0 | Game Winning RBIs | 1 |
| 0 | Intentional Walks | 0 |
| 1 | Doubles | 3 |
| 17 | Fly Balls | 22 |
| 0 | Caught Stealing | 0 |
| 147 | Pitches | 156 |
| 0 | Games Started | 0 |
| 0 | Pinch At Bats | 1 |
| 0 | Pinch Hits | 0 |
| 0.0 | Player Rating | 0.0 |
| 1 | Is Qualified | 1 |
| 0 | Is Qualified In Steals | 1 |
| 12 | Total Bases | 22 |
| 37 | Plate Appearances | 41 |
| 162.0 | Projected Home Runs | 0.0 |
| 2 | Extra Base Hits | 6 |
| 3.6 | Runs Created | 8.7 |
| .250 | Batting Average | .351 |
| .000 | Pinch Hit Average | .000 |
| .375 | Slugging Percentage | .595 |
| .219 | Secondary Average | .378 |
| .324 | On Base Percentage | .366 |
| .699 | OBP Pct + SLG Pct | .960 |
| 0.6 | Ground To Fly Ball Ratio | 0.5 |
| 3.6 | Runs Created Per 27 Outs | 9.0 |
| 45.0 | Batter Rating | 67.5 |
| 32.0 | At Bats Per Home Run | 0.0 |
| 0.00 | Stolen Base Percentage | 1.00 |
| 3.97 | Pitches Per Plate Appearance | 3.80 |
| .125 | Isolated Power | .243 |
| 0.50 | Walk To Strikeout Ratio | 0.33 |
| .081 | Walks Per Plate Appearance | .049 |
| -.031 | Secondary Average Minus Batting Average | .027 |
| 16.0 | Runs Produced | 19.0 |
| 1.0 | Runs Ratio | 0.7 |
| 0.4 | Patience Ratio | 0.6 |
| 0.3 | Balls In Play Average | 0.4 |
| 88.8 | MLB Rating | 107.3 |
| 0.0 | Offensive Wins Above Replacement | 0.0 |
| 0.0 | Wins Above Replacement | 0.0 |
Game Information
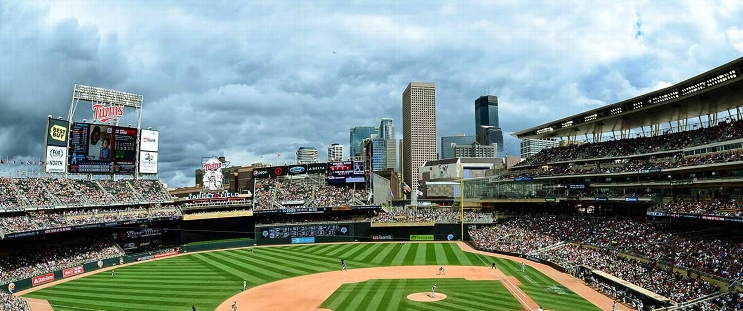
Location: Minneapolis, Minnesota
Attendance: 19,701 | Capacity:
2026 American League West Standings
| TEAM | W | L | PCT | GB | STRK |
|---|---|---|---|---|---|
 Houston |
- | 81 | W2 | 0.5 | 81 |
 Texas |
1 | 82 | L1 | 0.49382716 | 80 |
 Seattle |
5 | 86 | W2 | 0.4691358 | 76 |
| Athletics |
17 | 98 | L2 | 0.39506173 | 64 |
 Los Angeles |
19 | 100 | L2 | 0.38271606 | 62 |
2026 American League Central Standings
| TEAM | W | L | PCT | GB | STRK |
|---|---|---|---|---|---|
 Cleveland |
- | 77 | L1 | 0.52469134 | 85 |
 Chicago |
1 | 78 | W1 | 0.5185185 | 84 |
| Minnesota |
8 | 85 | W1 | 0.47530866 | 77 |
 Detroit |
9 | 86 | L1 | 0.4691358 | 76 |
 Kansas City |
16 | 93 | W1 | 0.42592594 | 69 |